The price of Bitcoin dipped below the $110,000 mark again today after attempting to surpass this threshold. Analysts noted that the 30-day moving average has reached its lowest point to date.
Summary
- Bitcoin’s price has dropped below $110,000 as its 30-day moving average falls to the lowest level seen since 2018.
- The decline may be linked to the end of the Fed-driven rally, leading to substantial selling pressure on BTC.
On August 27, Bitcoin (BTC) plummeted from its previous peak of $117,279 last Friday, settling around $109,526 and dipping below the $110,000 threshold in what can only be termed a flash crash. It is currently trading just above $110k as it strives to regain earlier levels.
Moreover, the 30-day moving average for the buy or sell ratio has reached its lowest point since May 2018, as pointed out by analysts at Crypto Quant. This suggests that the Bitcoin market is under considerable selling pressure in the near term.
While initial optimism surrounding potential interest rate cuts from the Fed Chair’s speech at Jackson Hole briefly boosted Bitcoin earlier this month, that momentum has since dissipated. Without new catalysts, Bitcoin may revisit the $100,000 mark or drop lower before finding stability.
Bitcoin Price Analysis

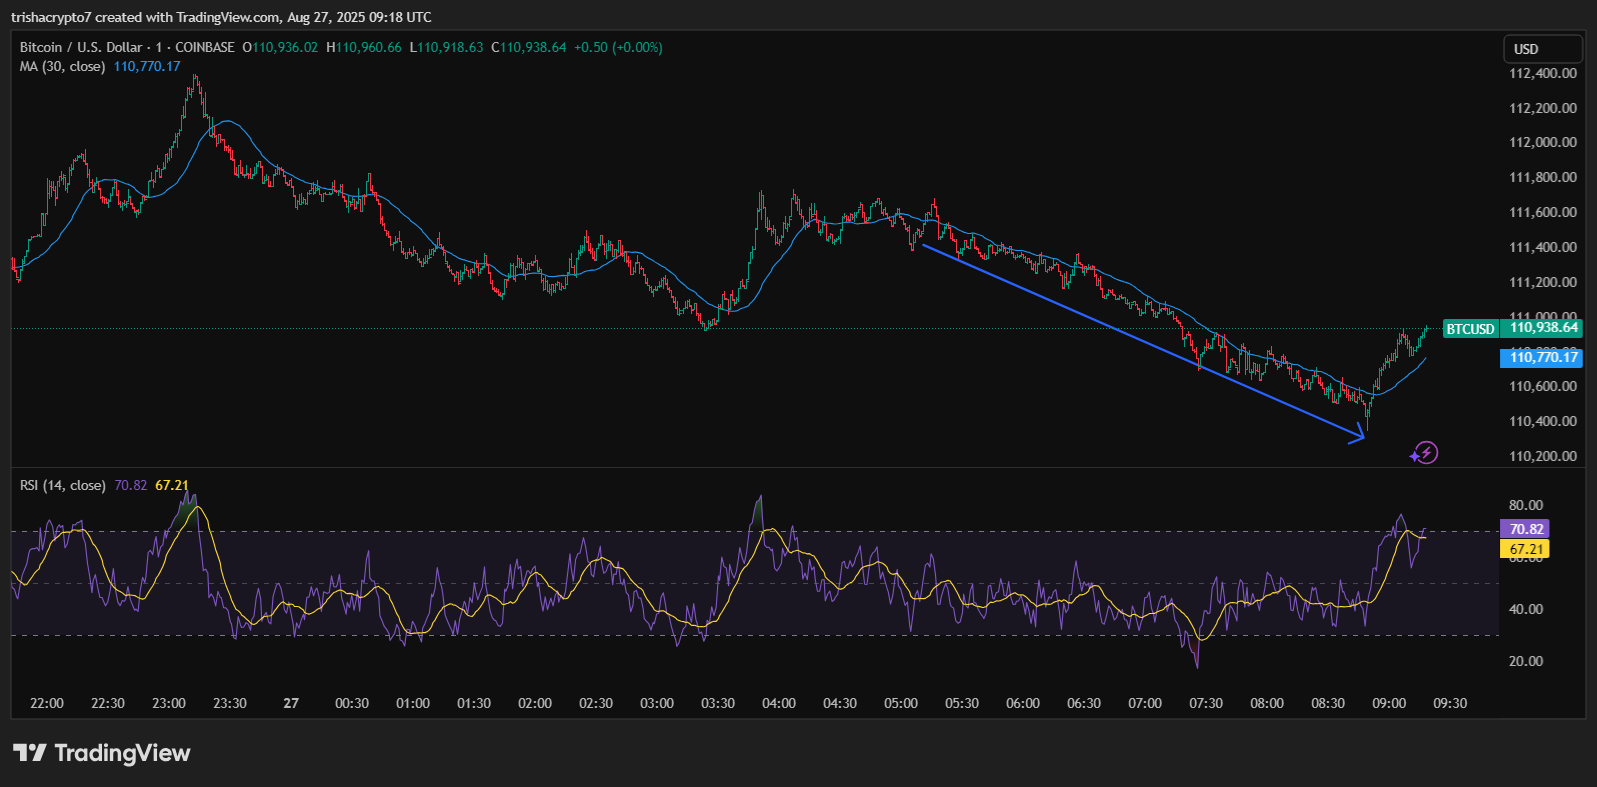
As illustrated in the chart, Bitcoin’s price has steadily declined, falling well below the 30-day moving average, which served as resistance throughout the downturn.
This bearish trend continued until reaching a low near $110,200, at which point it displayed signs of a possible reversal. Subsequently, Bitcoin has rebounded sharply, breaking out of the descending channel and rising above the moving average signified by the blue line. It is currently trading around $110,938.
Meanwhile, the Relative Strength Index indicates an oversold condition during the recent price drop, followed by a surge in upward momentum. Currently, the RSI has crossed above the 70 mark, reading 70.82, suggesting the asset may now be in overbought territory. This could imply a temporary exhaustion of bullish momentum, potentially leading to a short-term pullback.
Nevertheless, the strong rebound and breakout from the channel signal that bulls are regaining control. If the price remains above the moving average, a recovery may be on the horizon.
What Caused the Brief Bitcoin Crash?
Just prior to the crash, the RSI peaked at over 70, signaling that Bitcoin was in overbought territory. This likely prompted profit-taking and led short-term traders to exit their positions, which accelerated the decline.
As the rally lost momentum following the Fed’s speech, the downward trend in Bitcoin’s price persisted until buying interest was stimulated around the $110,200 level. After briefly entering oversold territory, it managed to recover quickly from the temporary plunge.
The crash was also exacerbated by a large whale sell-off that triggered the flash crash and widespread liquidations across the market. On August 26, a single wallet reportedly sold approximately 24,000 BTC, resulting in forced liquidations exceeding $940 million across Bitcoin, Ethereum, and other cryptocurrencies.

