Following a rocky beginning to September, Bitcoin continues to trade just above $115,000, with indicators of sell pressure suggesting a potential accumulation phase.
Summary
- Bitcoin’s price is stabilizing above $115K after a short decline, as sell pressure appears to be easing.
- Accumulation is gaining momentum, indicating that stronger investors are absorbing supply in anticipation of the next move.
- Key resistance is at $117K — a breakout could pave the way to $124K, while failure may lead to a retest of lower support levels.
Currently, Bitcoin is trading at $115,954, reflecting a 0.5% decrease from the previous day. The weekly range has oscillated between $110,870 and $116,705, placing the asset 6.6% below its peak of $124,128 on August 14.
Despite being down 2% over the last 30 days, Bitcoin (BTC) has seen a 3.4% increase over the past week. A notable 46.7% surge in daily trading volume to $45.1 billion from the previous day suggests a resurgence in market activity.
Derivatives also experienced an uptick, with volume rising by 42.18% to $75.28 billion, although open interest fell slightly by 1.32%, indicating that traders may be hesitant to initiate new positions.
Analysts Observe Diminishing Bitcoin Sell Pressure
On September 16, crypto analyst Ali Martinez highlighted that Bitcoin’s Sell-Side Risk Ratio has dipped below 0.1%, a threshold commonly linked to local bottoms, reduced sell pressure, and accumulation phases. He further noted that $116,963 is a vital supply barrier where sellers might seek to capitalize if Bitcoin continues its upward trend.
At the same time, CryptoQuant contributor Arab Chain pointed out a significant increase in the Bitcoin Scarcity Index on Binance, marking the first spike since June. A reduction in exchange supply, triggered by large investor withdrawals or a decline in sell orders, typically brings about this index’s rise. The last occurrence of this trend saw Bitcoin surge to $124,000.
However, Arab Chain cautioned that a quick retreat from this spike could indicate speculative behavior rather than sustained buying interest. Conversely, a prolonged positive reading could confirm the onset of a strong accumulation phase.
Bitcoin Price Technical Analysis
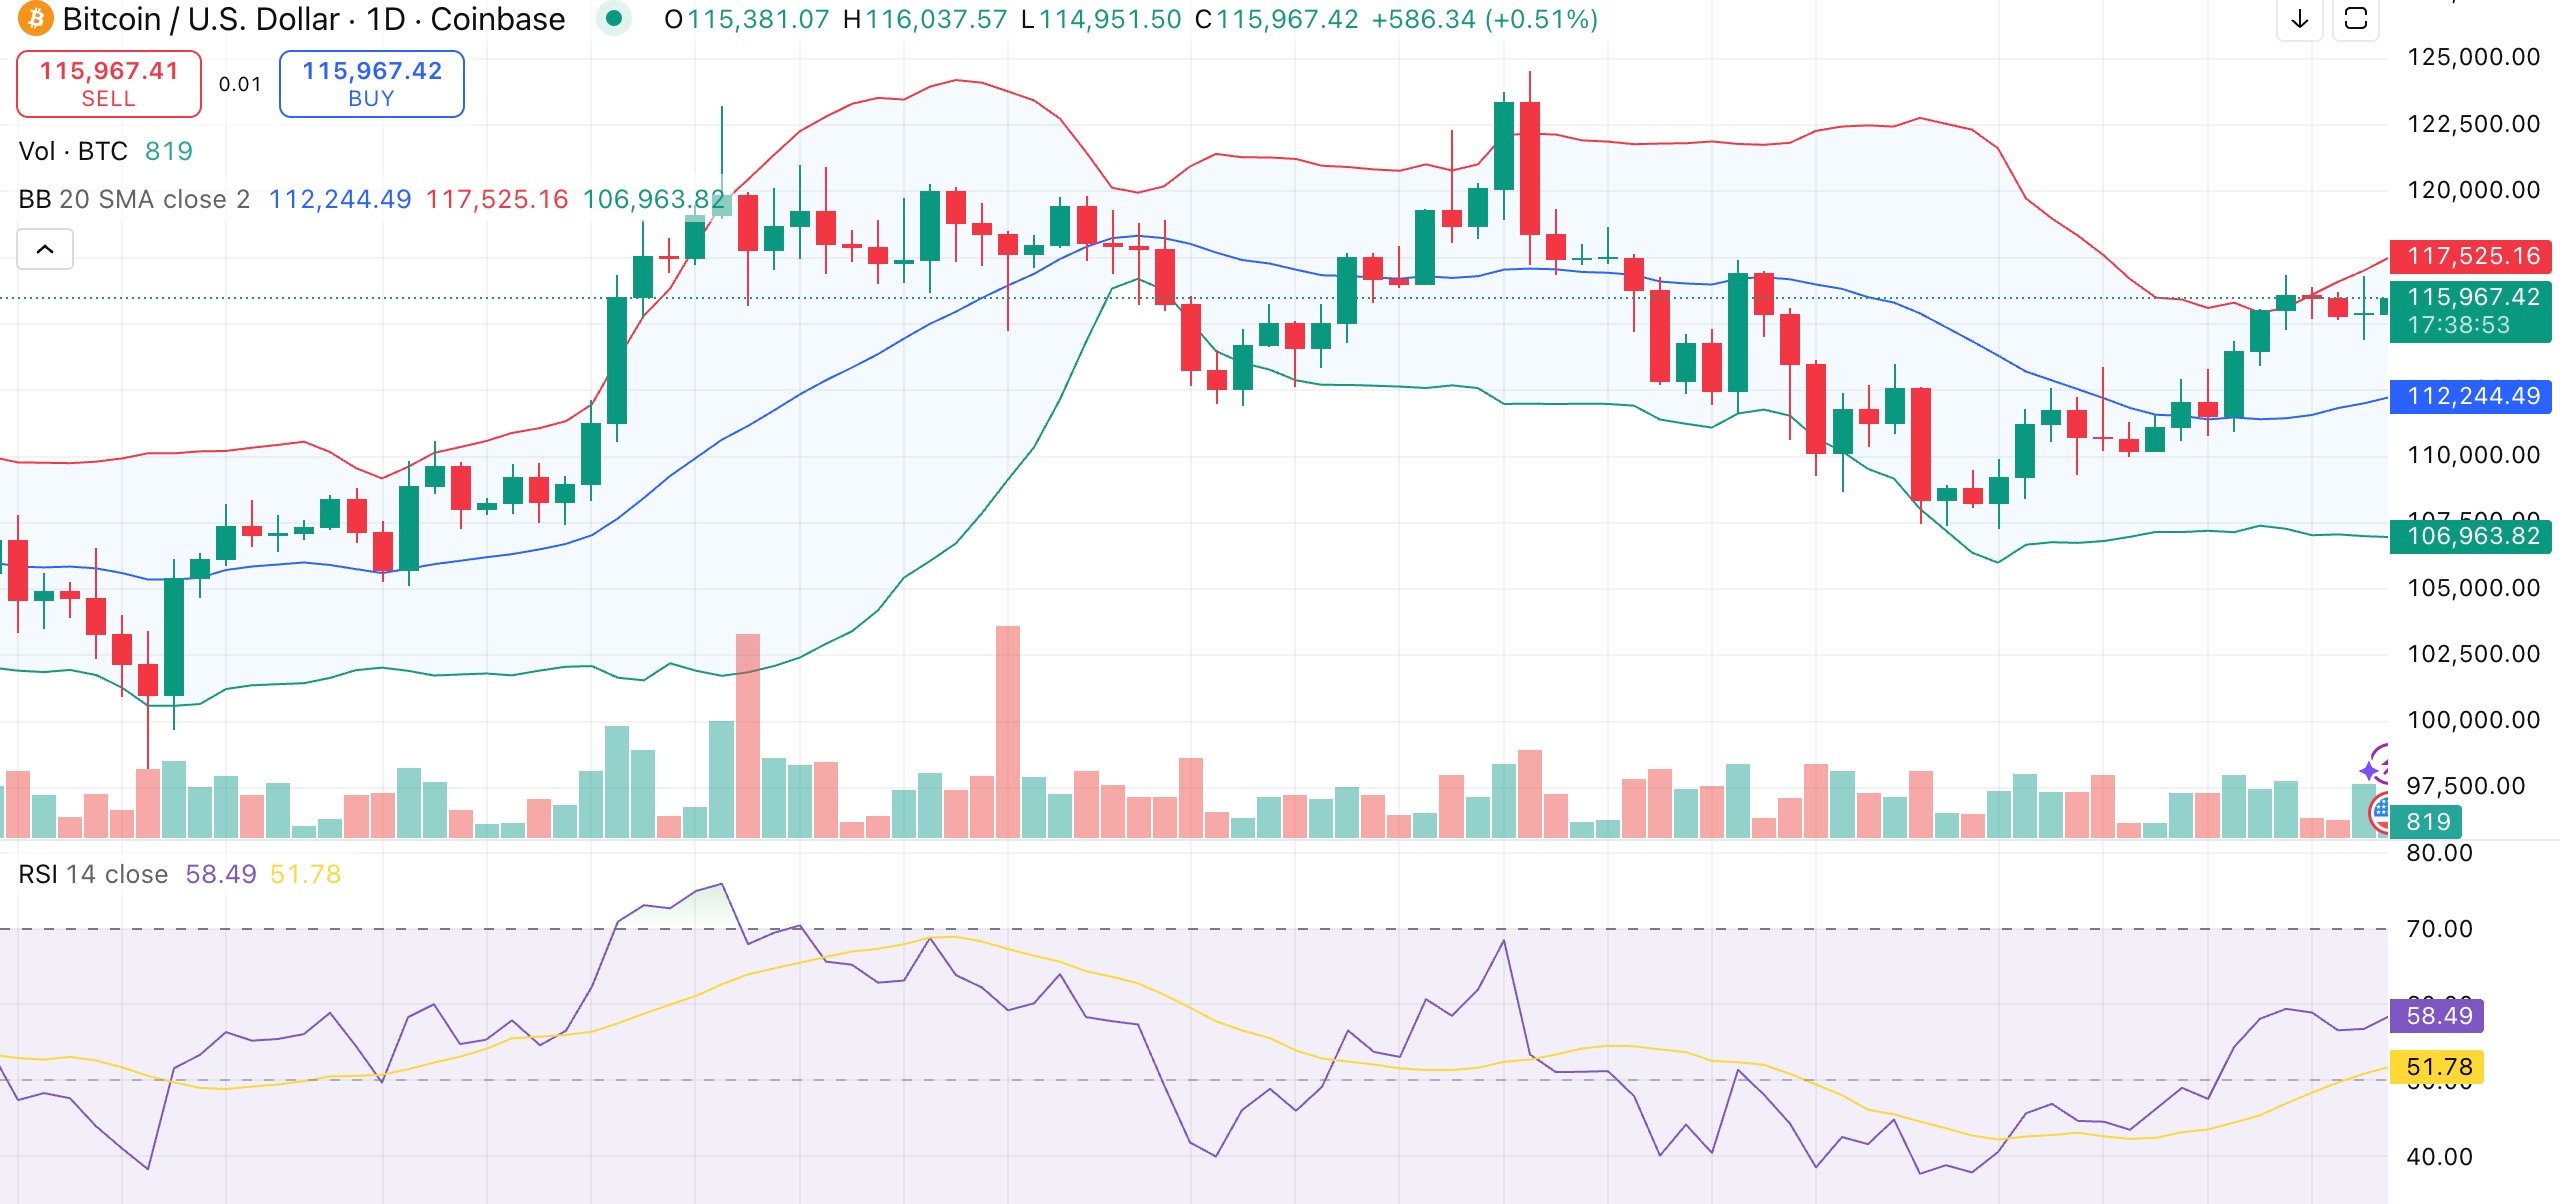
In its daily chart, Bitcoin shows consolidation just beneath resistance at $117,525, currently trading near the upper Bollinger Band. The relative strength index, at 58, signals neutral momentum, while the Momentum and MACD indicators present buy signals, suggesting a bullish short-term outlook.

Moving averages remain strongly supportive as Bitcoin trades above its 50-, 100-, and 200-day levels, all flashing “buy.” This alignment reflects underlying strength, despite the commodity channel index and stochastic RSI indicating overbought conditions and the potential for a brief pullback.
If Bitcoin surpasses the resistance level between $116,963 and $117,525, it may retest its all-time high of $124,128 from August. However, should this not occur, the price could return to support at $112,244 and possibly $106,963.

