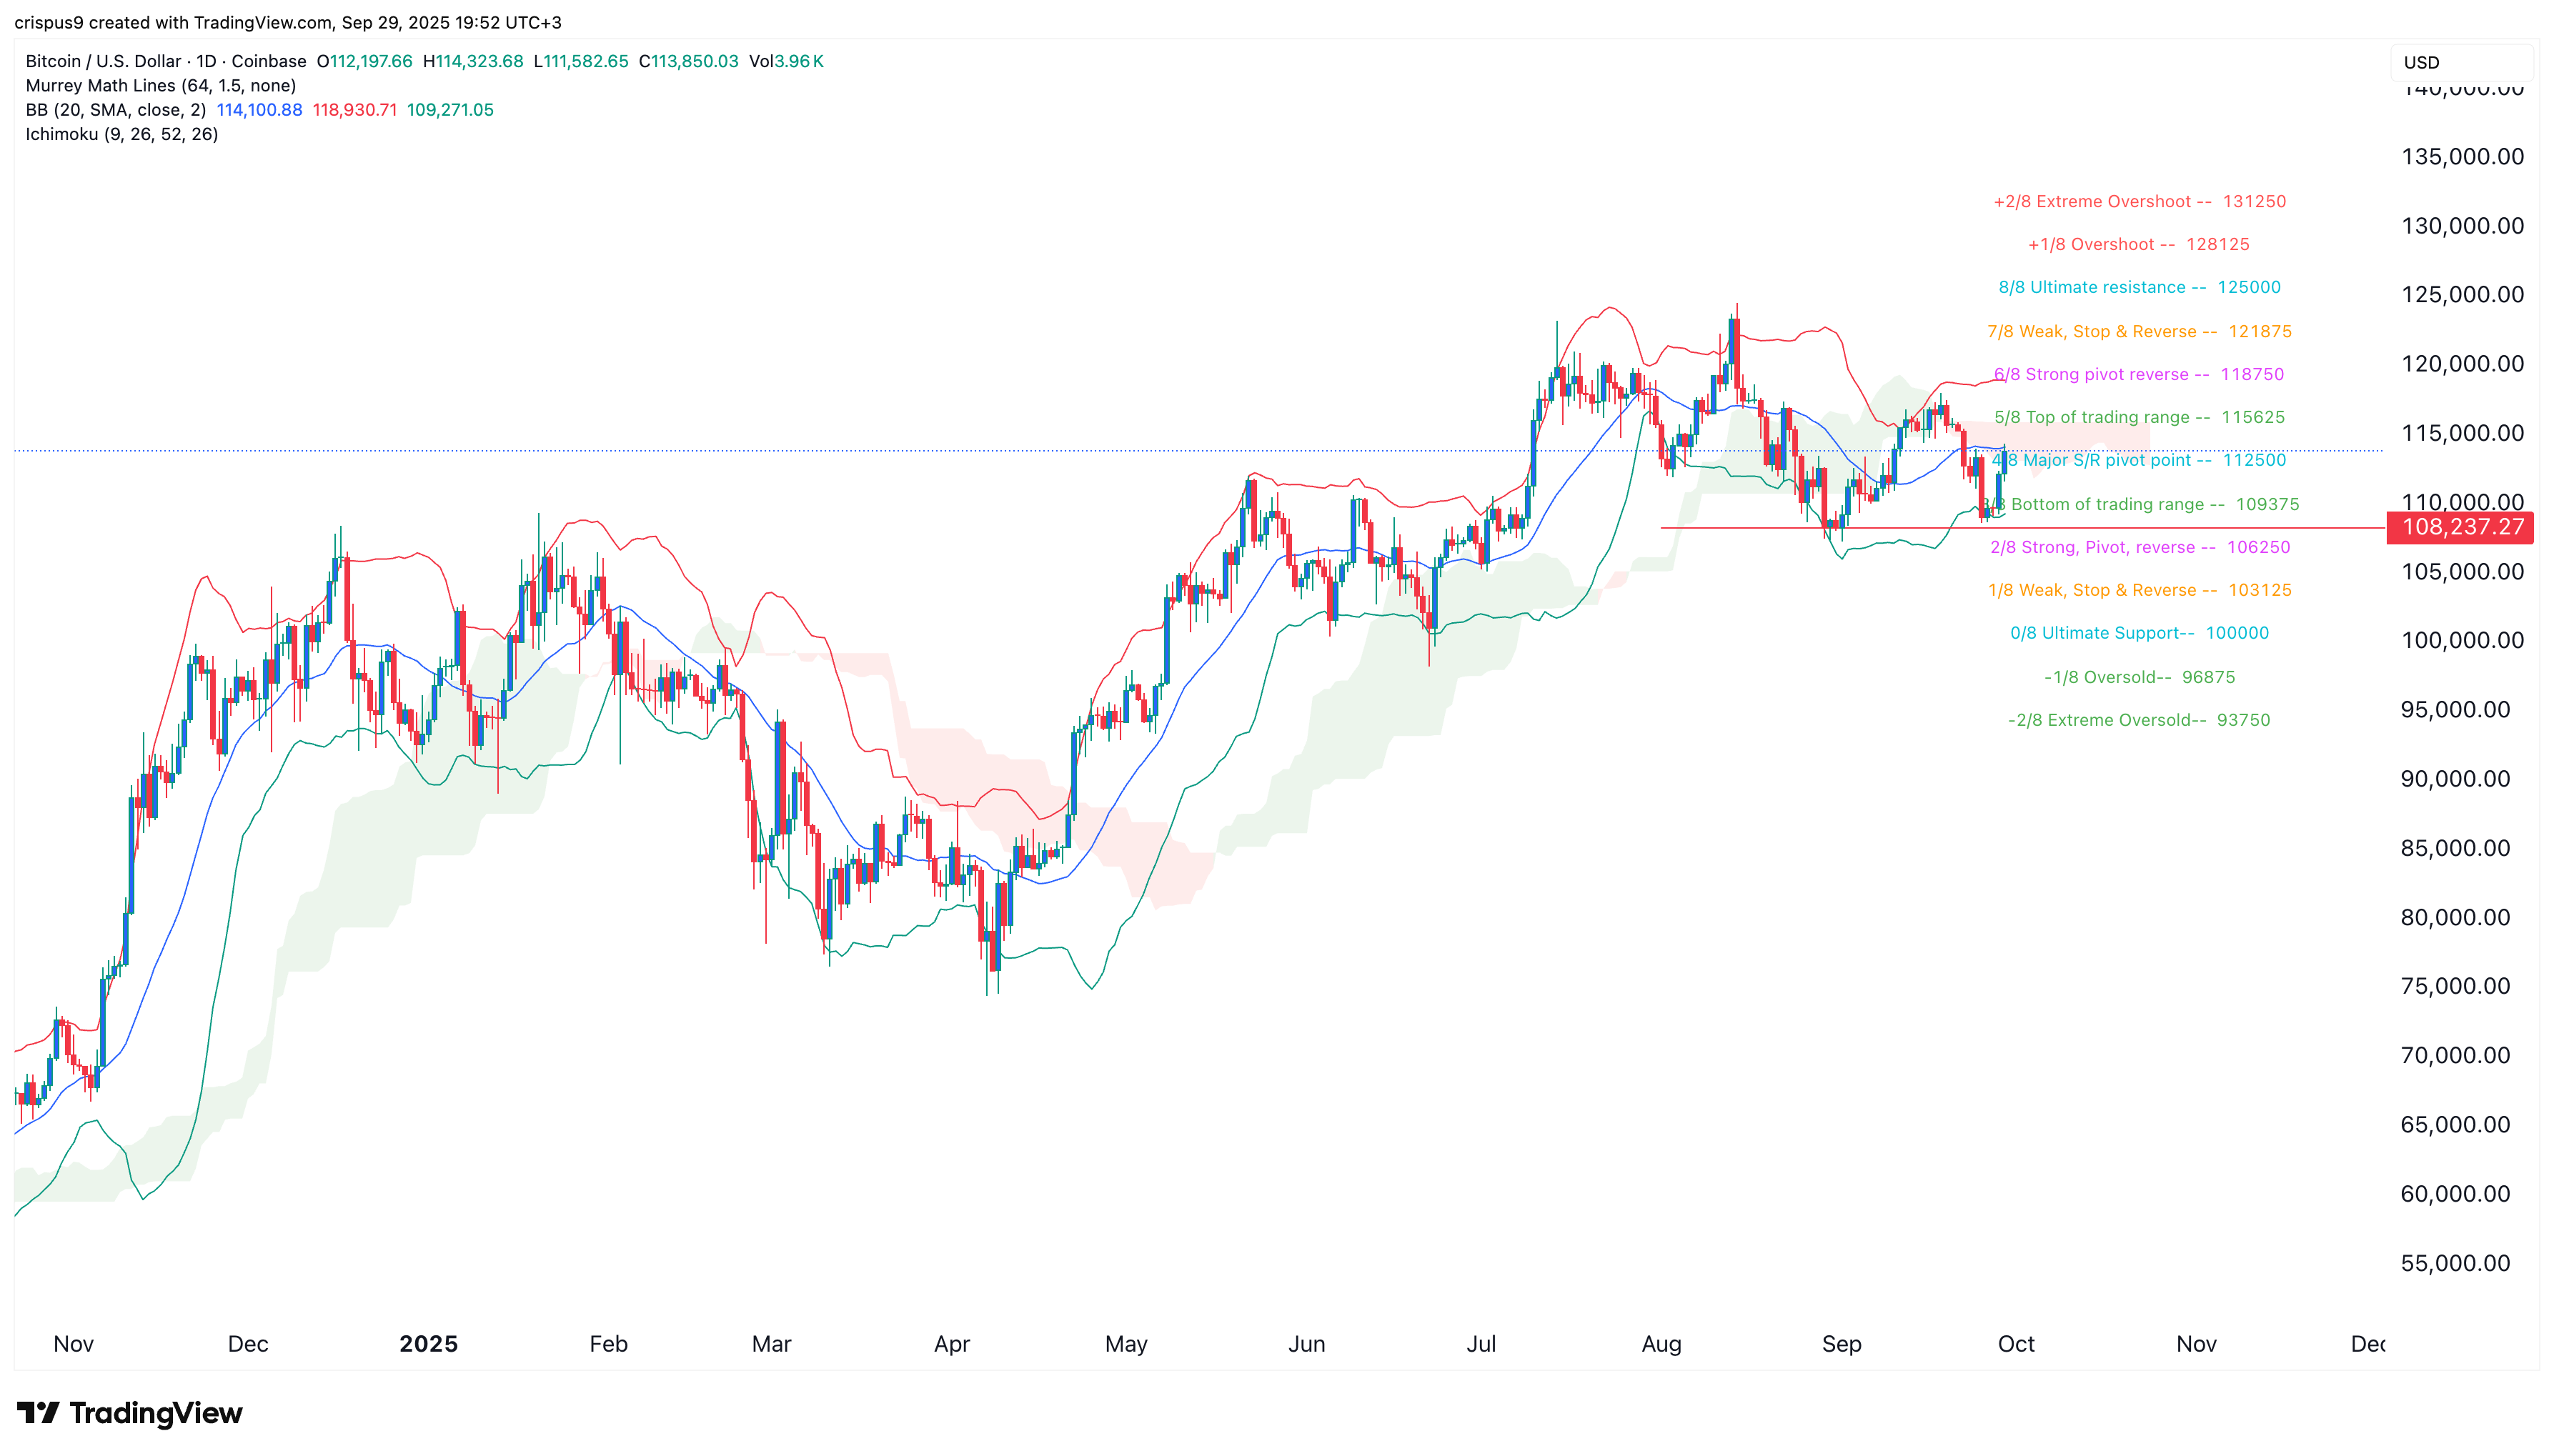
On Monday, Sept. 29, Bitcoin’s price increased for the second day in a row as traders anticipated crucial updates regarding the U.S. government shutdown, Donald Trump’s tariffs, and the closely monitored nonfarm payrolls data.
Summary
- A double-bottom chart pattern has formed for Bitcoin on the daily chart.
- A U.S. government shutdown is possible this Monday.
- The upcoming non-farm payrolls data on Friday is the next critical catalyst.
Bitcoin (BTC) surged to $114,000, significantly above last week’s low of $108,450. It has rebounded by 55% from its lowest point this year.
US Government Shutdown, Donald Trump’s Tariffs, and NFP Data
This week, Bitcoin price faces three primary catalysts. The first is the potential U.S. government shutdown set for October 1 unless Congress finalizes a spending solution.
Donald Trump is scheduled to meet with congressional leaders to address the impasse as both Republicans and Democrats hold firm on their positions.
If a shutdown occurs, nonessential services, including national parks and IRS operations, would cease, affecting approximately 40% of the federal workforce.
The economic consequences will vary based on duration. A lengthy shutdown could dampen output and possibly compel the Federal Reserve to lower interest rates.
Another driving factor for Bitcoin will be the upcoming ADP and Bureau of Labor Statistics nonfarm payroll figures. Analysts predict the data will indicate a sluggish labor market as companies contend with Trump’s tariffs.
A lackluster jobs report may prove favorable for Bitcoin, increasing the chances of interest rate cuts by the Federal Reserve during the last two meetings of the year. However, while the ADP report will be released, the official NFP report may not appear if the government shuts down.
Additionally, uncertainty surrounding trade, particularly after Trump threatened significant tariffs on furniture and films produced outside the U.S., could also sway Bitcoin prices. This follows threats regarding tariffs on imported pharmaceuticals made the previous week.
Bitcoin Price Technical Analysis

The daily chart indicates that Bitcoin has developed a double-bottom pattern at $108,236, a well-known bullish reversal pattern in technical analysis.
Bitcoin has surpassed the significant support/resistance pivot point of the Murrey Math Lines at $112,500. It continues to stay above the 100-day exponential moving average and the midline of the Bollinger Bands.
Bitcoin has entered the Ichimoku Cloud indicator. Thus, it is likely to maintain an upward trajectory as bulls aim for the strong pivot reversal point at $118,750. However, a drop below support at $108,236 would nullify this bullish outlook.

