Bitcoin’s price increased by 2.5% in the last 24 hours, hovering around $115,700, yet it still lags behind Ethereum and others that have achieved new highs.
Even though it remains nearly 7% below its peak, various key on-chain and technical indicators suggest the conditions for a potential breakout are developing, reminiscent of the earlier rally this month.
Whale Selling Pressure Is Weakening
For weeks, Bitcoin’s price has been trailing as whales shifted their assets into other investments, leaving retail buyers to carry much of the movement.
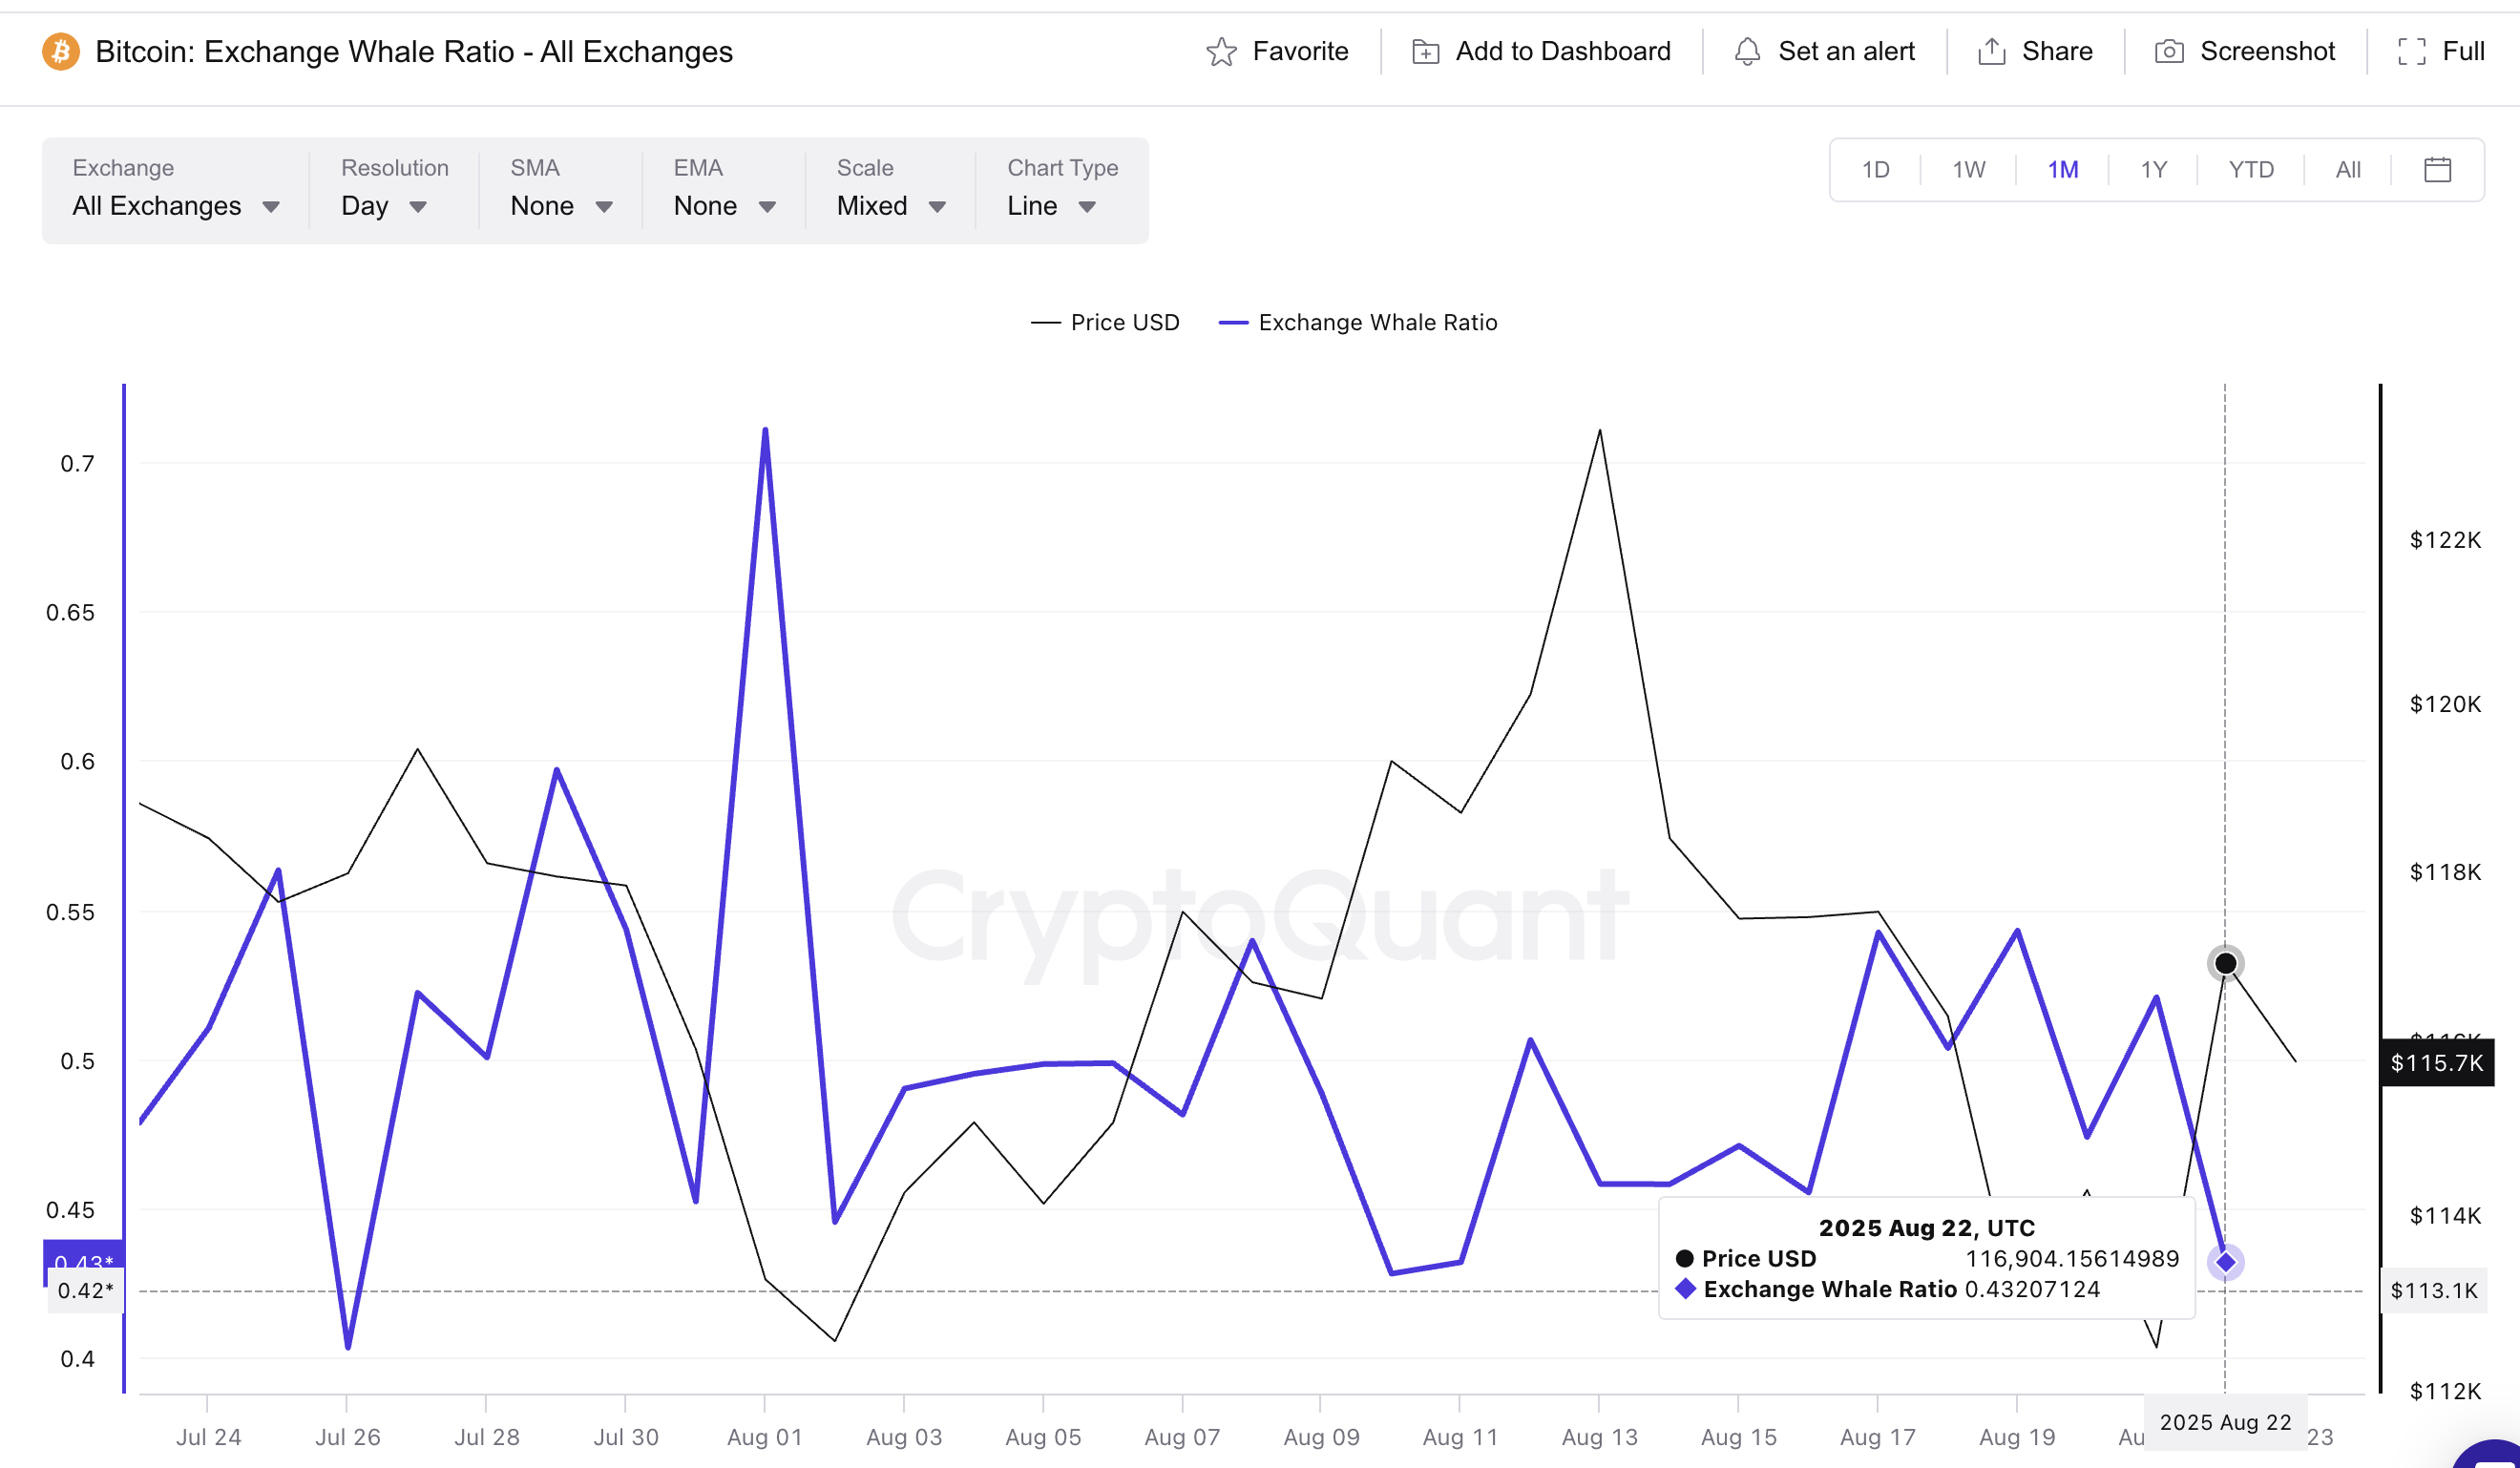
This made it essential to observe whether whale selling was finally easing. The Exchange Whale Ratio, which indicates the proportion of the top 10 inflows relative to all inflows to exchanges, offers that insight.

This ratio has decreased from 0.54 on August 19 to 0.43 on August 22, its lowest in almost two weeks. A similar decline occurred on August 10 when it fell to 0.42, which preceded a sharp Bitcoin rally from $119,305 to $124,000 — an increase of approximately 3.9%.
If history repeats itself, the current conditions could pave the way for a similar upward extension, potentially reaching a new all-time high.
Interested in more token insights? Subscribe to Editor Harsh Notariya’s Daily Crypto Newsletter here.
HODL Waves Point to Accumulation
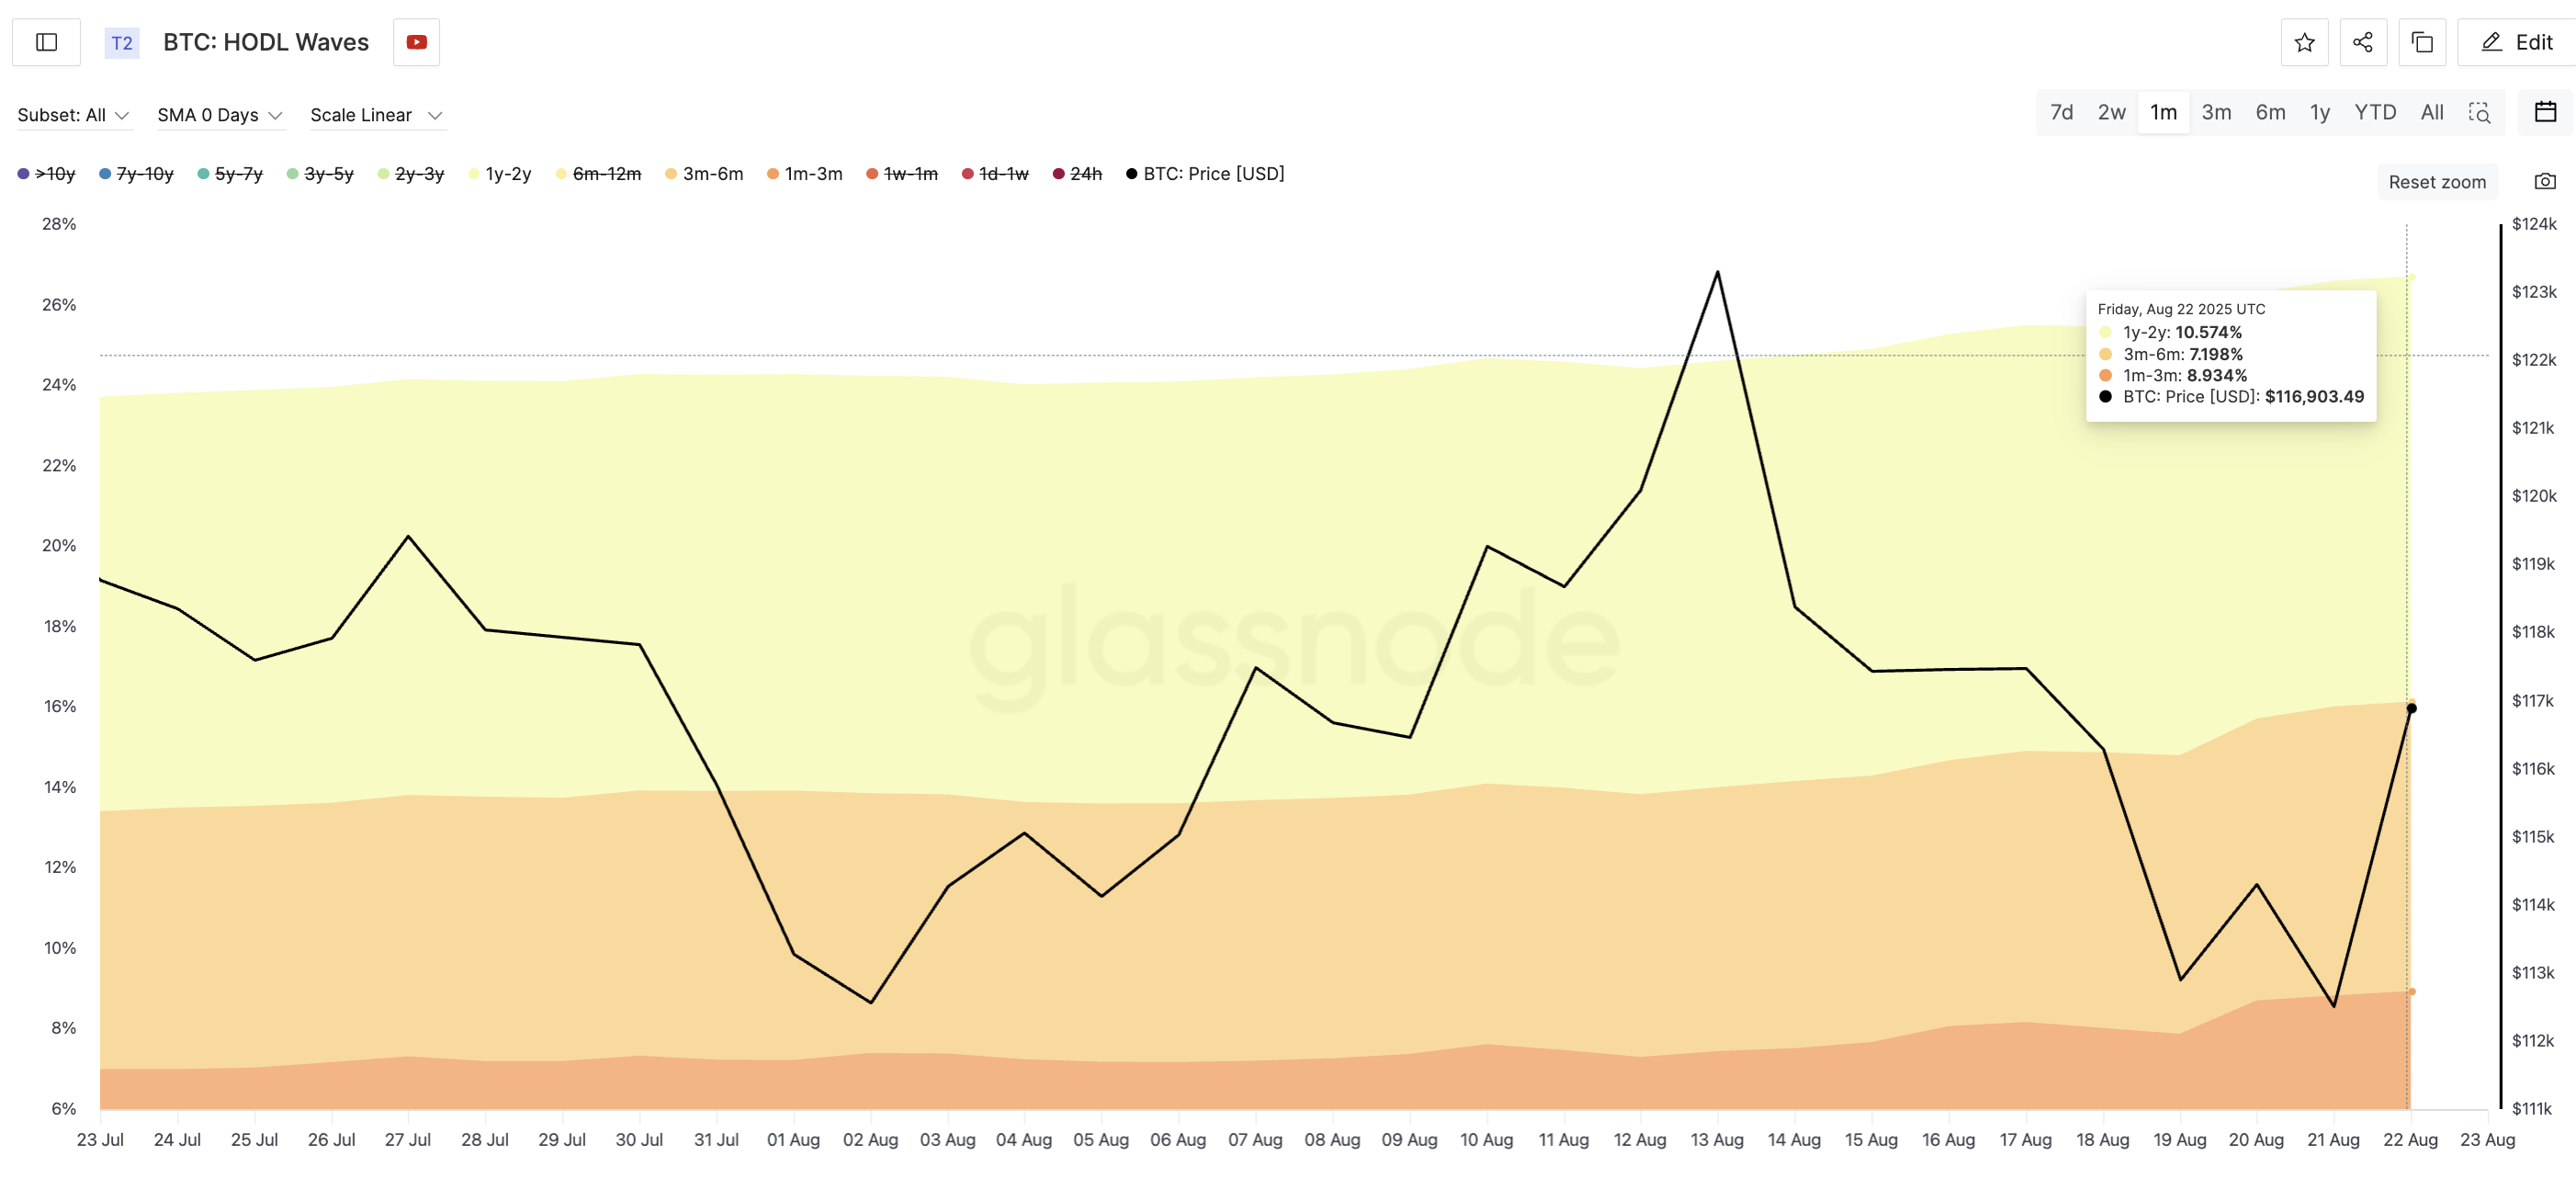
With BTC selling pressure subsiding, the next inquiry is if mid-term and long-term holders are increasing their holdings. The HODL Waves metric analyzes the percentage of Bitcoin supply distributed across age brackets.

Over the past month, significant cohorts have bolstered their positions:
- 1y–2y wallets increased from 10.31% to 10.57%
- 3m–6m wallets rose from 6.40% to 7.19%
- 1m–3m wallets expanded from 6.99% to 8.93%
This widespread accumulation during volatility indicates strong conviction. Coupled with decreasing whale exchange flows, the market structure suggests a potential Bitcoin price breakout.
Bitcoin Price Levels Define the Breakout Path
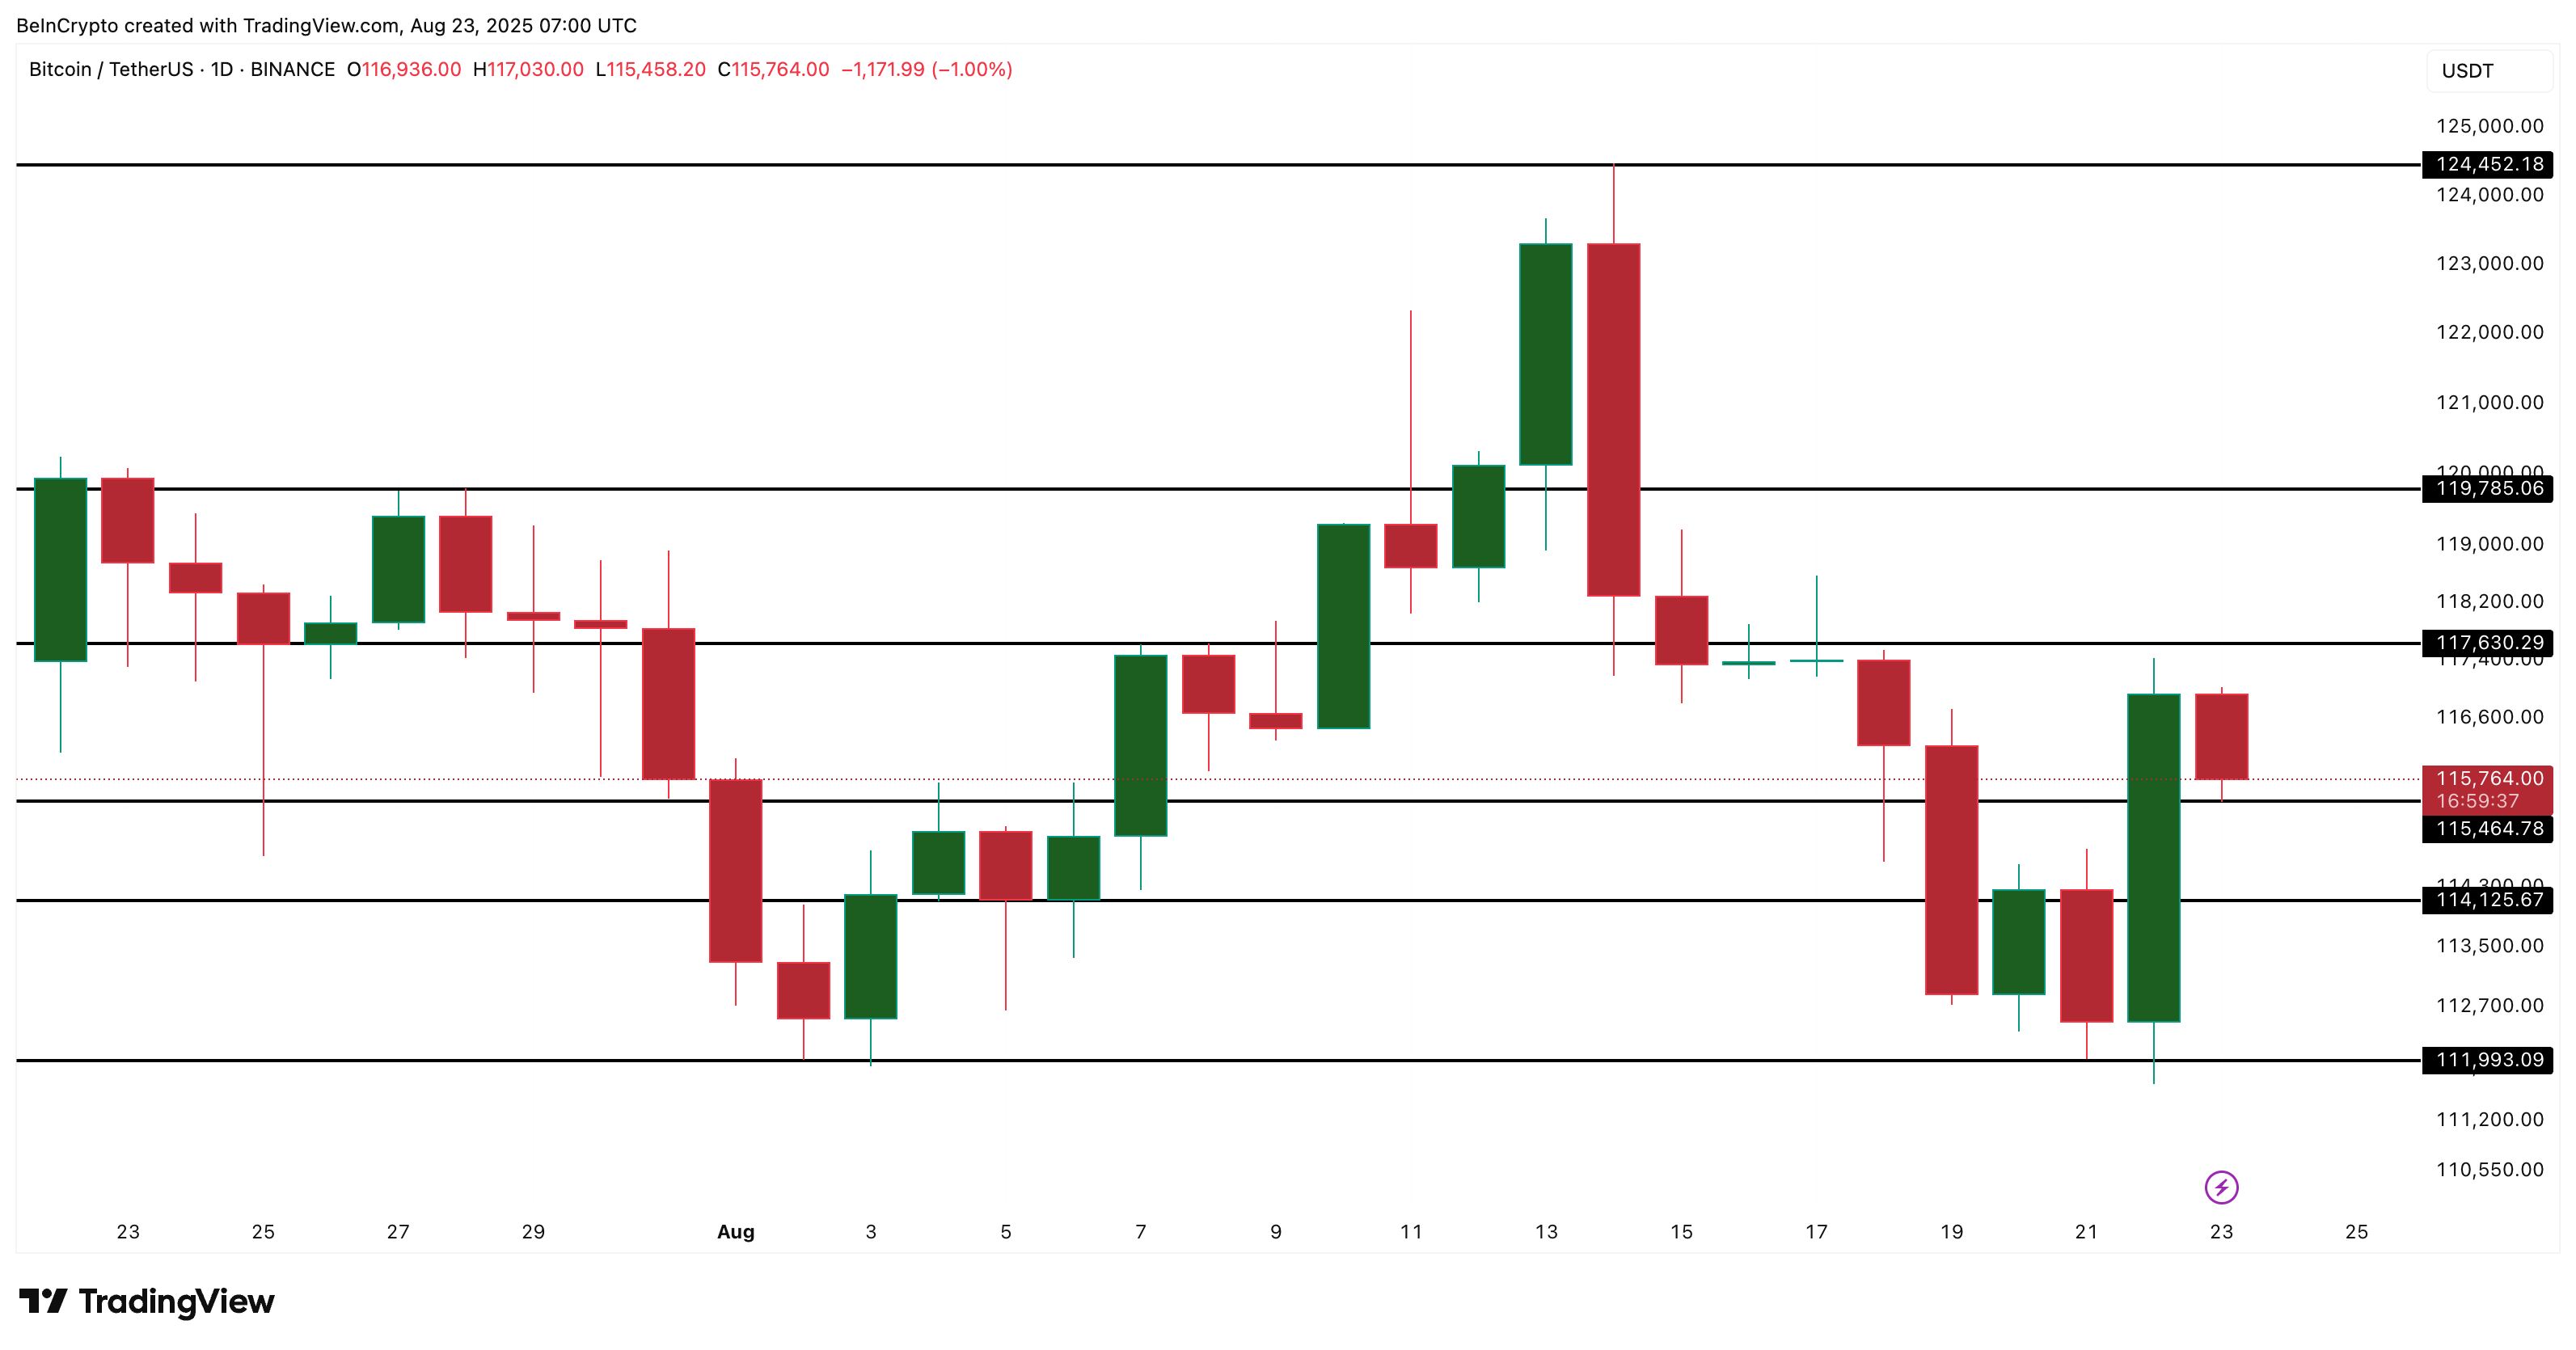
The technical landscape unites these signals. Bitcoin is currently trading just above solid support at $115,400. A vital resistance level is at $117,600, with $119,700 serving as the critical breakout trigger for Bitcoin to advance towards and even surpass its all-time high.

Conversely, a drop below $114,100, especially $111,900, would shift momentum to a bearish outlook in the short term.
Should the exchange whale ratio repeat its August 10th trend, Bitcoin’s price may surge nearly 4% from current levels, driving it past $119,000, directly into breakout territory.
From that point, the stage would be prepared for a re-examination of the all-time high, supporting the notion that this rally is simply delayed, not denied.
The post Whale Indicators Show a New Price Direction For Bitcoin appeared first on BeInCrypto.

