This month, the MSTR stock has entered a bull market, surging over 20% from its September lows, coinciding with a rebound in Bitcoin.
Summary
- MSTR shares have bounced back as Bitcoin approaches its all-time high.
- Technical analysis suggests Bitcoin could rise to $131,250 in this cycle.
- MSTR might recover and test the significant resistance level at $450.
Strategy, the leading treasury company, reached an intraday high of $355, marking its highest point since August 19. This recovery followed a near 40% drop from its peak earlier this year, hitting its lowest level since April 11.
The rebound in MSTR mirrors the trends seen in other Bitcoin treasury companies such as Metaplanet and Bullish, both of which have recorded double-digit increases in recent days.
This rally aligns with the recent resurgence in Bitcoin (BTC) prices, which rose from a low of $108,585 in September to $122,250 today. Notably, Strategy is the largest publicly traded Bitcoin holder, owning 640,031 coins valued at $78 billion.
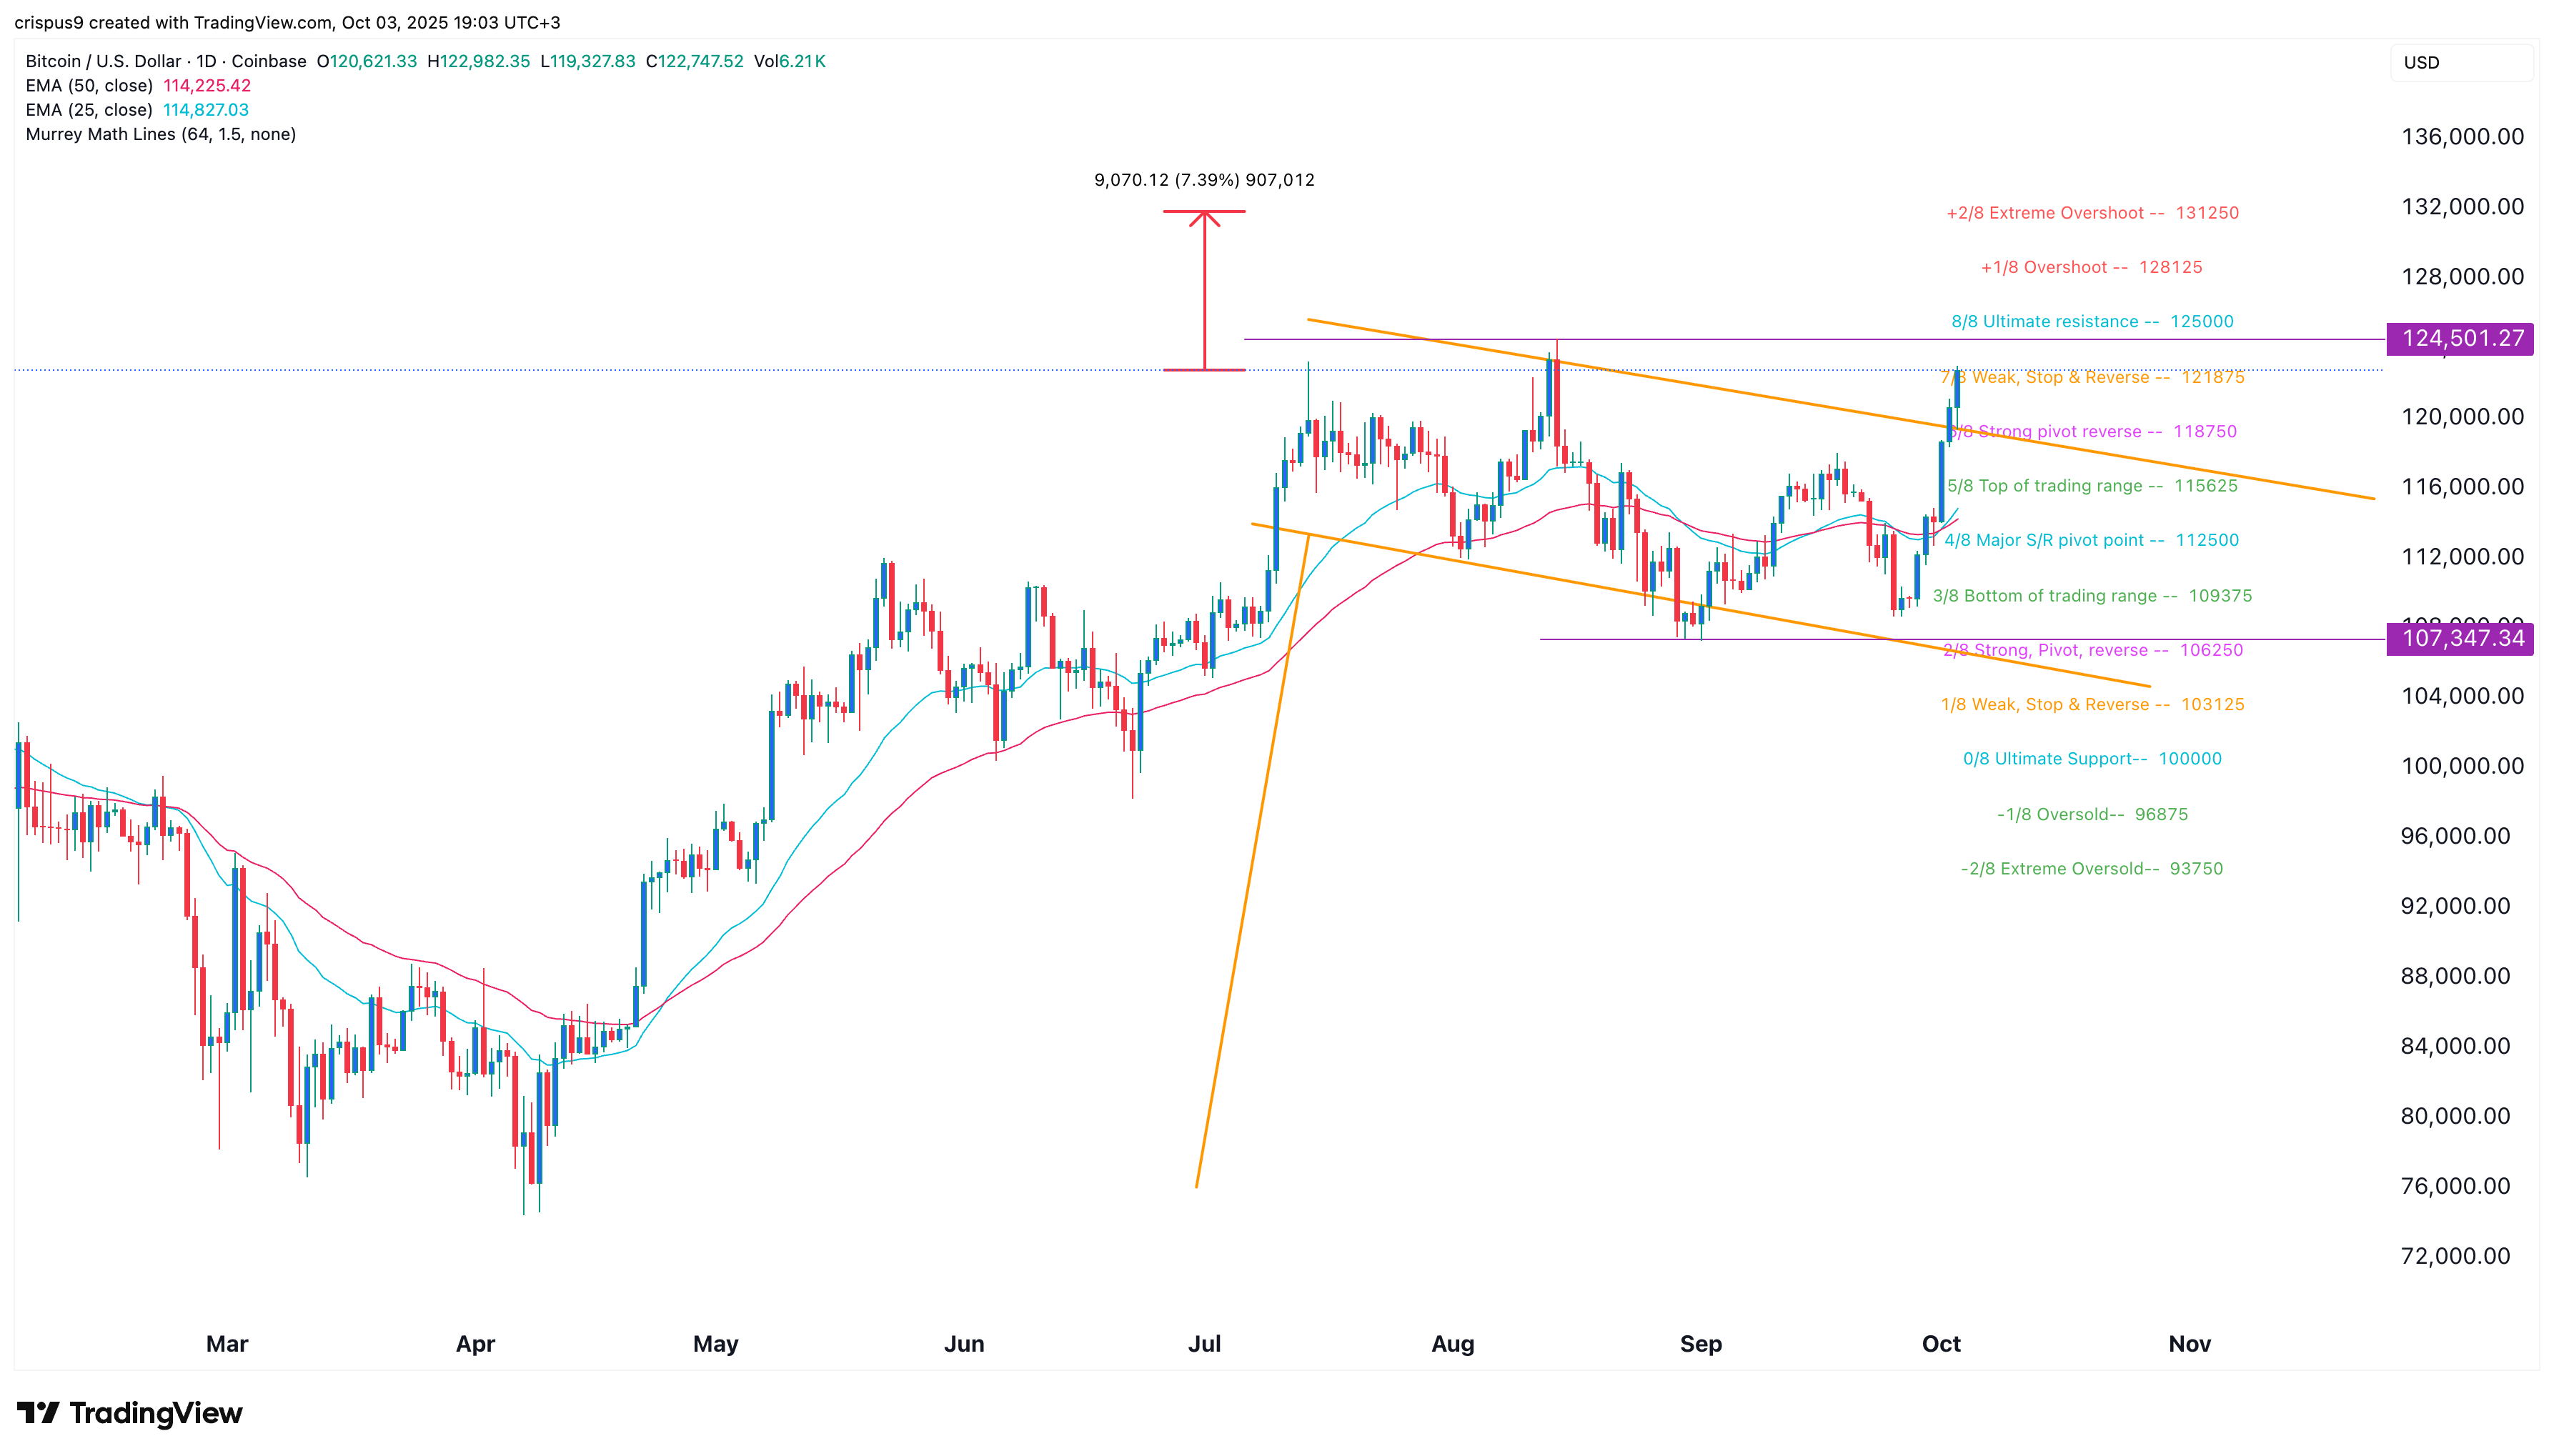
Technical indicators show that Bitcoin may have further upside potential, with a possibility of challenging the all-time high of $124,200 and beyond. The chart below illustrates Bitcoin forming a bullish flag pattern comprised of a vertical line and a descending channel, resembling a flag in motion.
The flag pattern, along with Murrey Math Lines analysis, indicates a potential Bitcoin surge to $131,250, representing an extreme overshoot level and 7.40% above the current price.

The likelihood of a Bitcoin price rally increased following the release of a weak jobs report by ADP early this week. The report indicated that the private sector lost over 36,000 jobs in September, significantly lower than the anticipated gain of 50,000. The Federal Reserve has shifted its focus from inflation to the labor market, raising the prospect of another rate cut this month.
MSTR stock price technical analysis
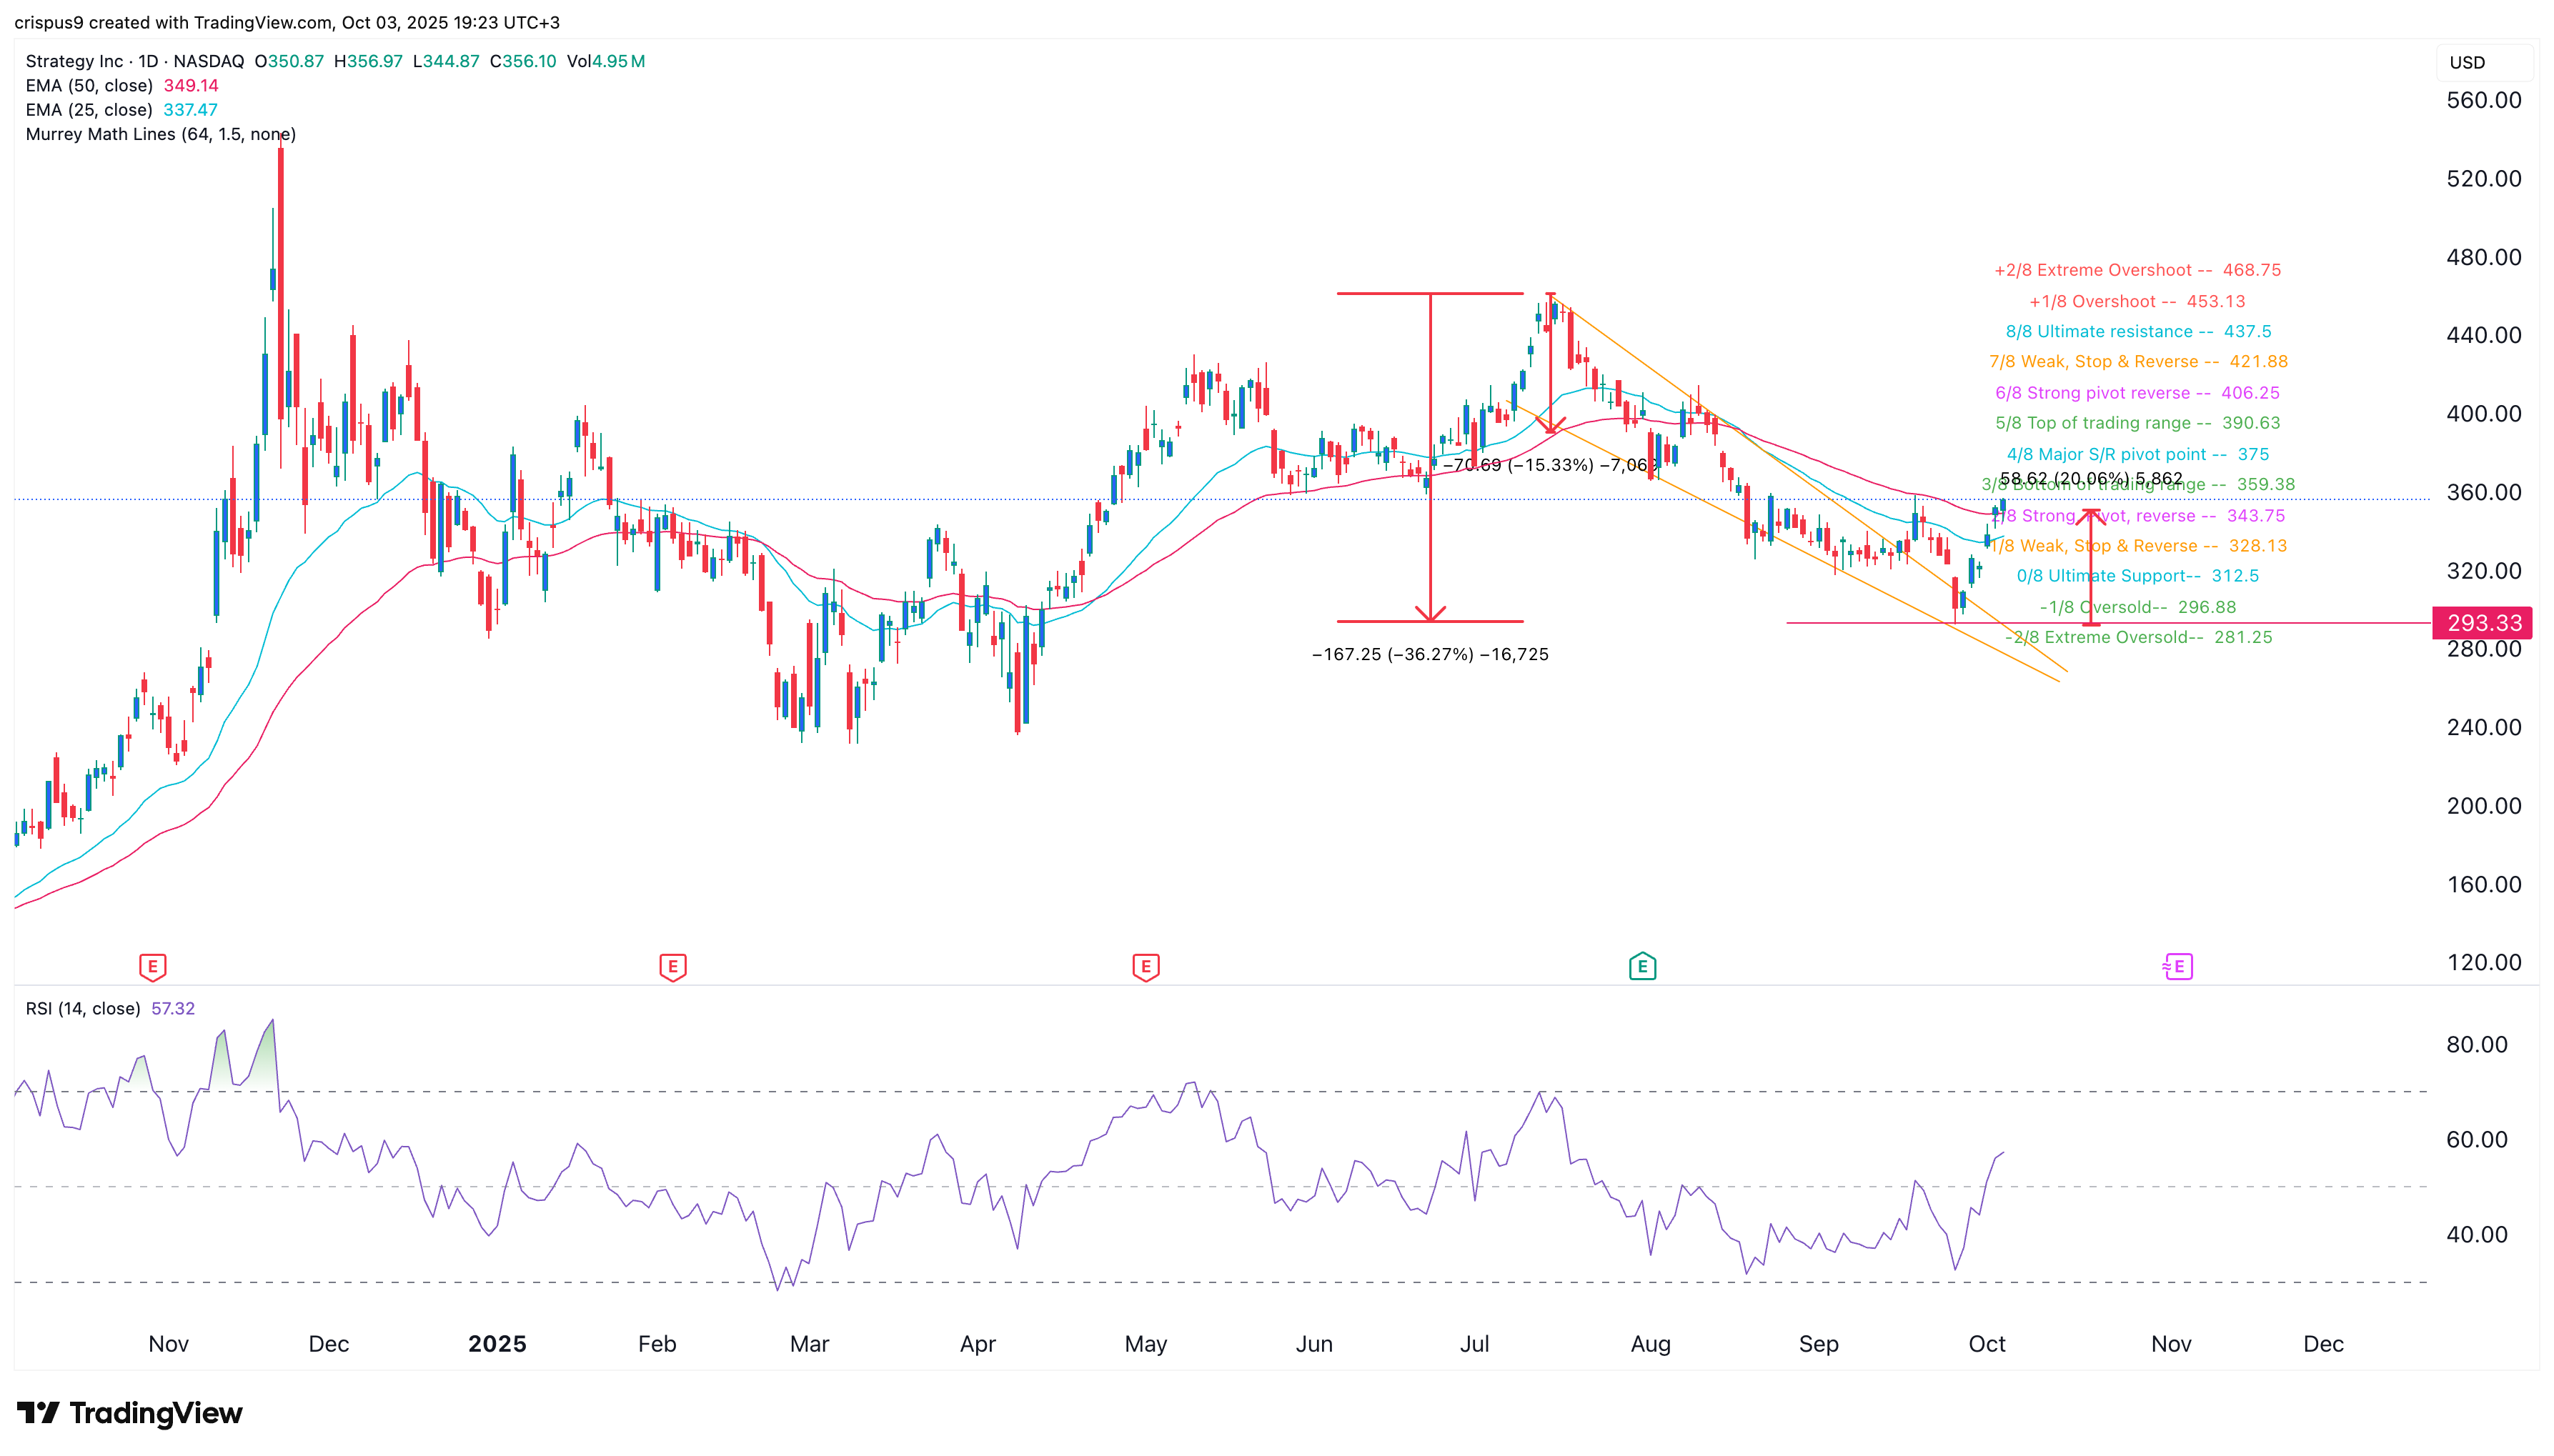
The daily chart indicates that the MSTR stock price has bounced back after reaching a low of $293 in September.

This recovery followed the formation of a notably bullish falling wedge chart pattern, characterized by two converging and descending trendlines. This formation typically leads to a strong bullish breakout.
The stock has now risen above the 50-day and 25-day Exponential Moving Averages, with the Relative Strength Index trending upward and crossing the neutral threshold at 50.
Consequently, the stock is likely to continue ascending as bulls aim for the psychological level of $462. A decline below the support level of $300 would invalidate this bullish forecast.

