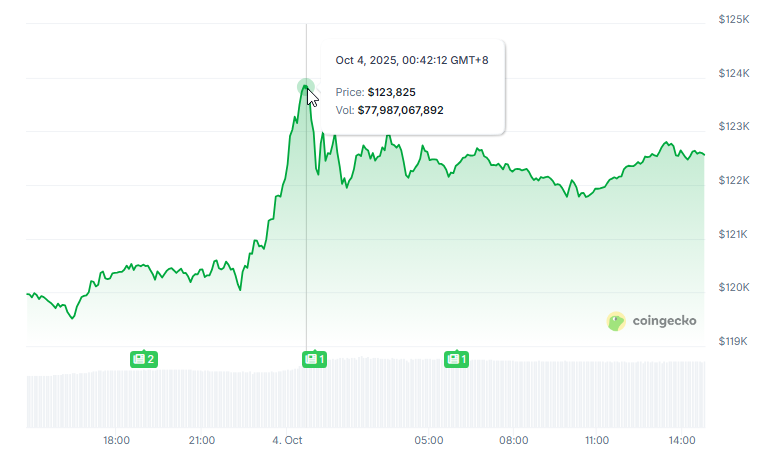
Recent market analyses indicate that Bitcoin has reached a significant resistance level this week, driven by increased investment in futures and spot markets. Prices have consistently stayed above multiple support zones, with traders eyeing $123,500 as the next immediate challenge before pushing for new highs.
Related Reading
Bitcoin Price Approaches Final Resistance
For weeks, Bitcoin’s trading range has remained stable, exhibiting a consistent trend of higher highs and higher lows. After bouncing off the channel’s lower boundary—aligning with the market’s control point—the rally has surged to the $123,825 high-timeframe resistance area.

Current data shows this level as the final major hurdle before Bitcoin potentially enters uncharted territory. If this resistance is overtaken, the next target in the trading range is around $131,000.
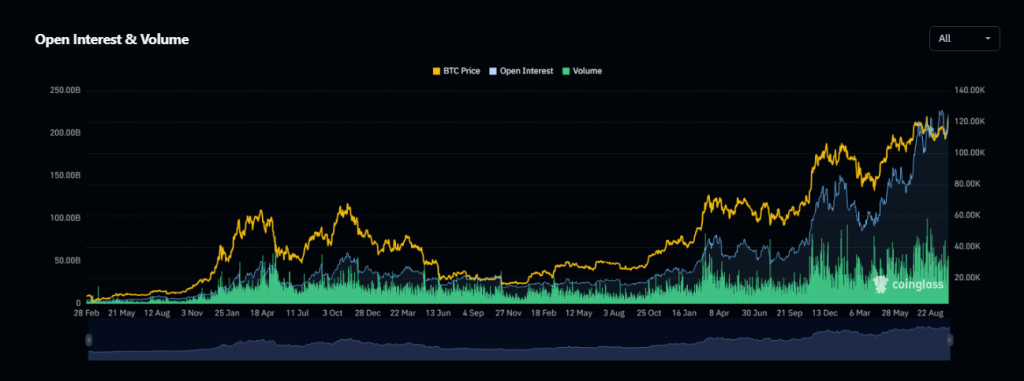
The increasing open interest supports this momentum. As prices rise, the number of active positions has also expanded, which traders interpret as a sign of growing participation, rather than just a transient retail surge.
It has been reported that Strategy’s Bitcoin holdings have increased to $77.4 billion as BTC has reclaimed the $120,000 threshold, a development that market analysts attribute to heightened institutional interest.

Source: Coinglass
Institutions Increasing Large Positions
Spot Bitcoin ETFs have seen a significant influx of capital. Reports indicate that total inflows into these ETFs have reached $58 billion, with $23 billion occurring this year.
Analysts project that an additional $20 billion may flow in before the year’s end. This level of demand is being characterized by some investors as a structural bid, tightening the available supply on exchanges.
Wall Street analysts are now setting aggressive price targets. One major bank has suggested a target of $231K, while Geoff Kendrick, head of digital assets research at Standard Chartered, forecasts a $135,000 short-term target, indicating that $200,000 could be achievable by the end of 2025.
Kendrick’s perspective hinges on three main factors: consistent ETF inflows, increasing adoption among firms, and steady market sentiment despite broader macroeconomic concerns.
The price structure and open interest are aligned in a manner that appeals to many traders. So far, each rally has been followed by controlled pullbacks, which some interpret as healthy consolidation rather than a downturn. However, the area above previous highs has limited liquidity; moves in that space tend to occur rapidly and erratically.
Related Reading
What Traders Should Monitor Going Forward
It is crucial to keep an eye on how the market reacts around $123,500. A decisive breakthrough accompanied by increased volume and rising open interest would likely hasten the ascent toward $131,000 or more. Conversely, if this level serves as resistance, anticipate a steeper correction that may test lower support levels within the channel.
Featured image from Gemini, chart from TradingView

