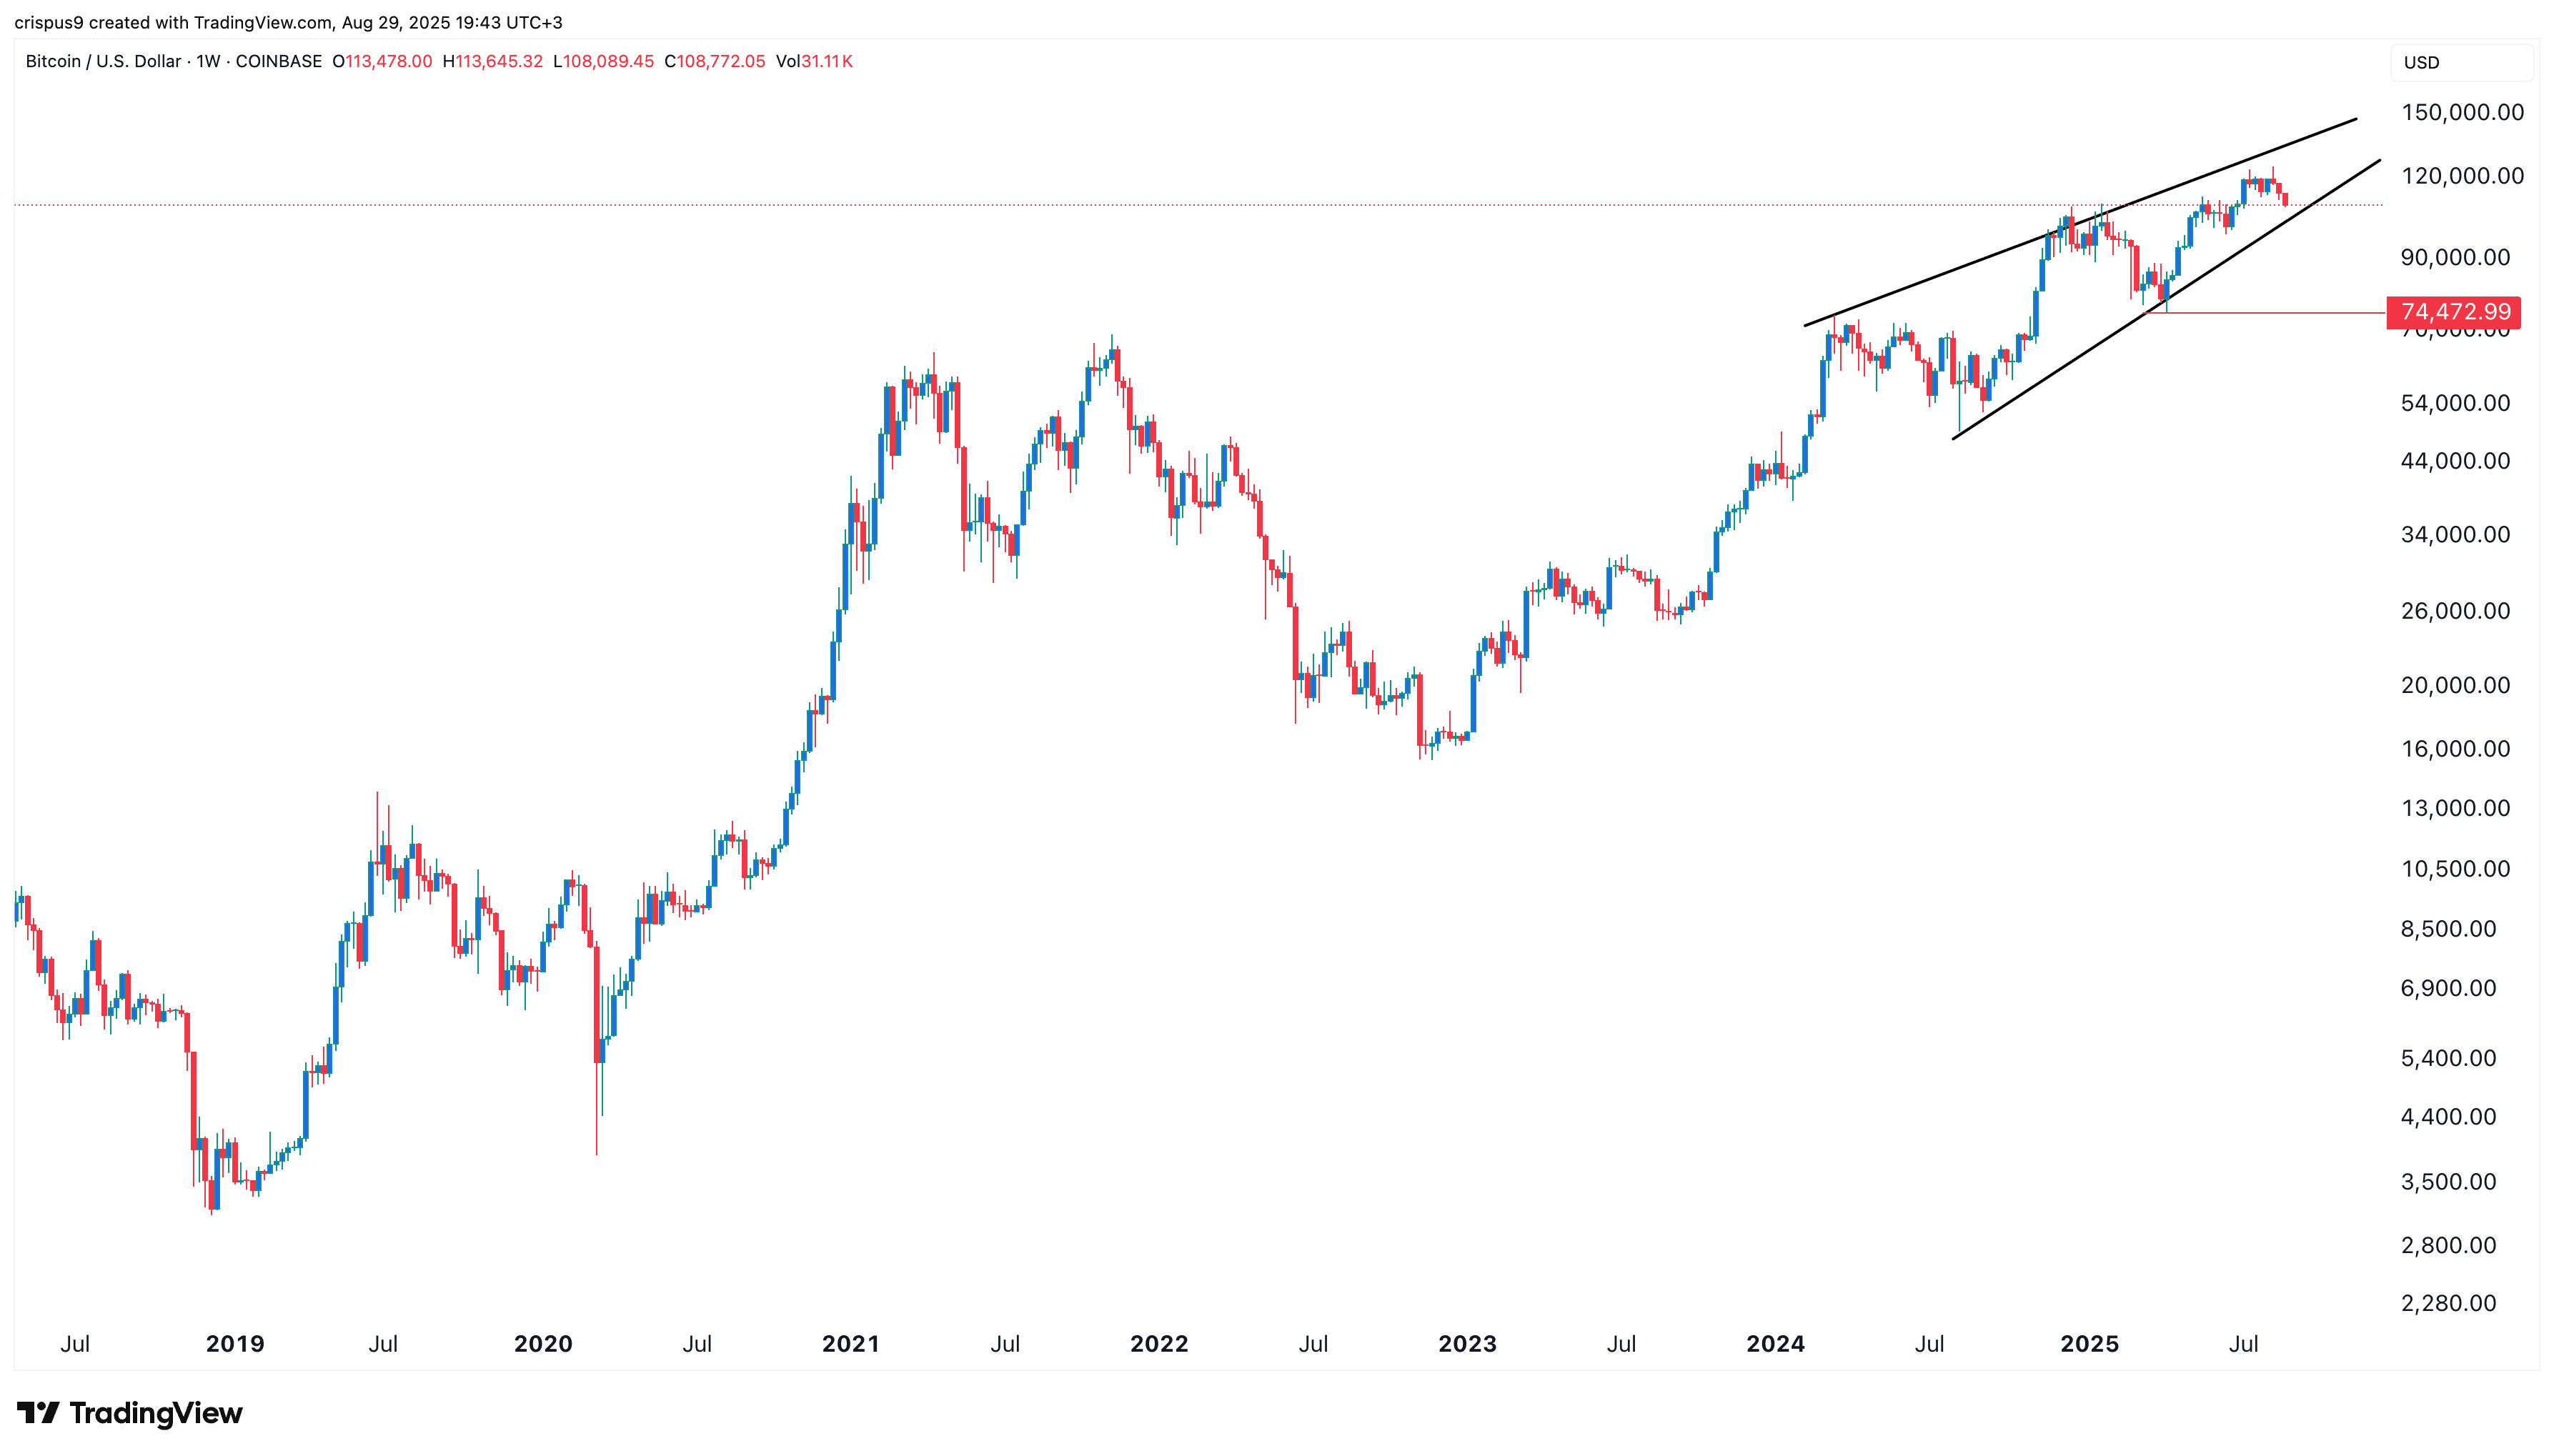
The price of Bitcoin is poised to decline for the third week in a row as traders prepare for a $15 billion options expiry amid the emergence of risky chart patterns on the weekly chart.
Summary
- Bitcoin has experienced a downturn for three consecutive weeks.
- More than $15 billion worth of BTC and Ethereum options are set to expire today.
- Technical analysis indicates potential further declines in BTC prices.
On Friday, Aug. 29, Bitcoin (BTC) plummeted to $108,000, a significant drop from its all-time high of $124,200, with ongoing risk of continued declines if it fails to hold a crucial support level.
Bitcoin price drops ahead of critical options expiry
Cryptocurrencies and stocks frequently experience sharp drops or increased volatility prior to a major options expiry. It is not uncommon for the stock market to decline ahead of the triple-witching event when stock and index options expire.
The decline in Bitcoin’s price comes as investors anticipate a significant options expiry worth over $15 billion. Data from Deribit, a leading derivatives exchange, reveals that short sellers are betting on Bitcoin dropping to between $95,000 and $110,000.
According to CoinGlass, options open interest has surged in the past three days, reaching a peak of $57 billion on Friday. An increase in options open interest is typical as a major expiry approaches.

Historically, Bitcoin prices tend to recover a few days after the expiry date, and this pattern may play out again, especially since the weighted funding rate has remained in the positive territory recently.
However, a significant concern is that the expiry coincides with a risk-averse sentiment among investors. For instance, major indices like the Nasdaq 100 and the Dow Jones fell by 1.10% and 0.35%, respectively, on Friday, with Nvidia leading the downturn. This decline followed a report indicating persistent consumer prices in the US.
Concern over BTC price’s risky chart pattern

Another notable risk is the gradual formation of a precarious pattern since March of last year. The weekly logarithmic chart indicates the emergence of an ascending wedge pattern.
The upper trend line connects the higher highs since March 11 of last year, while the lower trend line connects the lowest points since August. These lines are nearing convergence, which could lead to a sharper decline in the upcoming weeks.
A bearish forecast for BTC will be confirmed if the coin falls below the lower boundary of the wedge pattern at $105. Should this occur, it could plunge to the support level at $74,470, its lowest point in April.
Disclosure: This article does not constitute investment advice. The content and materials presented on this page are for educational purposes only.

