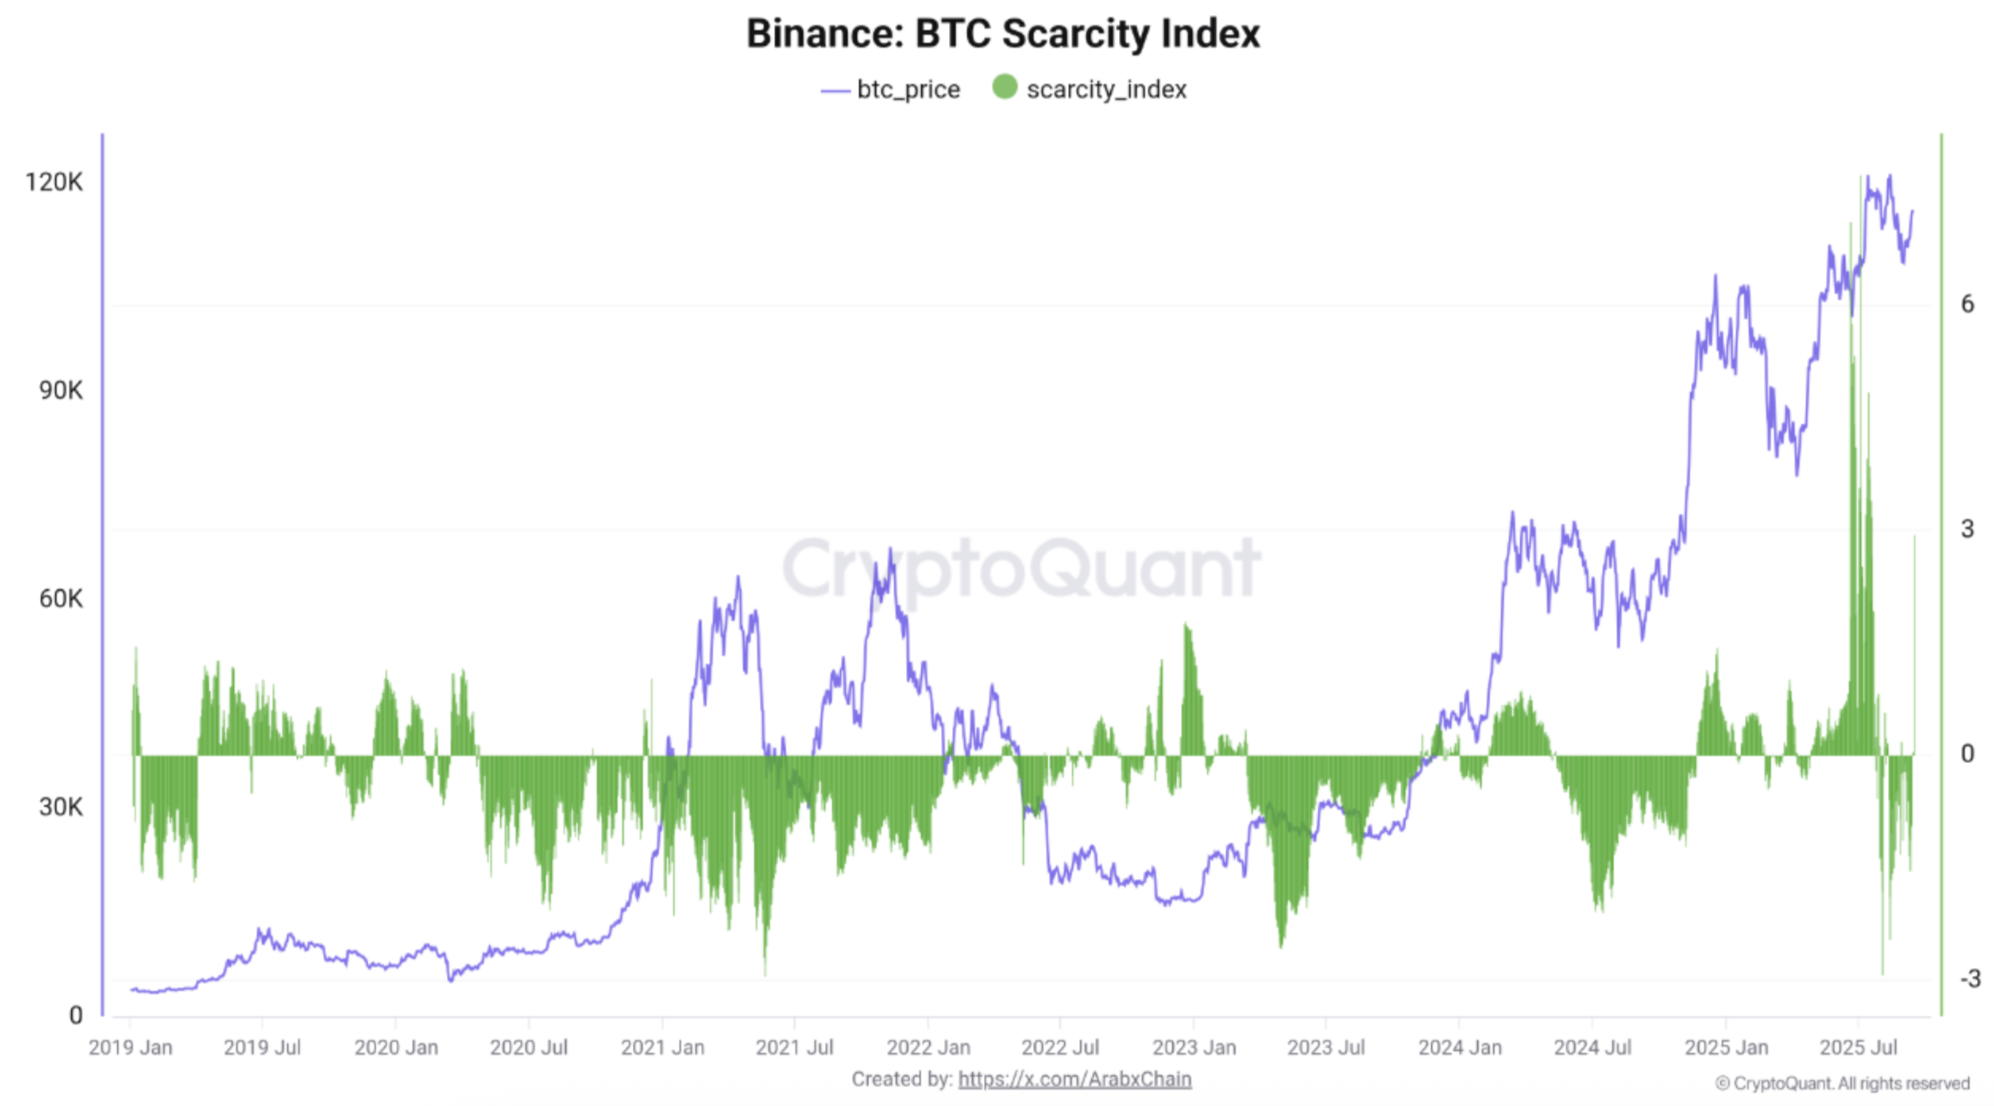
Following a weekend peak of $116,689 on September 15, Bitcoin (BTC) has slightly dipped, currently trading just above $114,000. Recent data from Binance crypto exchange shows that the Bitcoin Scarcity Index has experienced its first spike since June 2025.
Bitcoin Scarcity Index Rises, Is a BTC Rally Coming?
As highlighted in a CryptoQuant Quicktake post by contributor Arab Chain, the Bitcoin Scarcity Index marked its first increase yesterday since June 2025. The analyst pointed to the latest exchange data from Binance to validate this rise in the Bitcoin Scarcity Index.
Related Reading
For those unfamiliar, the Bitcoin Scarcity Index gauges the restricted supply of Bitcoin on exchanges compared to immediate buying demand. An increase in the index typically signals strong accumulation by large investors or institutions, indicating potential upward price pressure.
In their analysis, Arab Chain stated that the recent rise in the Bitcoin Scarcity Index suggests either a significant amount of BTC was withdrawn from Binance, or a marked decline in sell orders on the exchange.
Consequently, the supply of BTC on Binance became suddenly limited. This kind of movement is typically linked to large investors—often referred to as whales or sharks—who hold considerable amounts of BTC. Arab Chain noted:
The index surges when immediate buying pressure outstrips available supply, as if buyers are in a rush to secure Bitcoin. Such spikes are often tied to positive news or sudden capital influx. This pattern was observed last June, lasting several days, after which Bitcoin rose to around $124,000.
If the Bitcoin Scarcity Index stays positive for several consecutive days, BTC may confirm the start of a robust accumulation phase and a continuation of the upward trend.
Conversely, if the index surges quickly and then falls just as swiftly, it could indicate speculative activity or order liquidations. Typically, this phase precedes a quieter period or a price correction.
In recent months, the Bitcoin Scarcity Index has reached new all-time highs (ATH). The following chart illustrates the metric peaking at +6 before swiftly dropping back toward neutral and even negative territory.

Is BTC Slowing Down?
Arab Chain concluded that the disparity between BTC’s high price and the index’s rapid return to or below zero indicates a decline in strong buying momentum.
Related Reading
Nonetheless, there are some positive indicators. Recently, the leading cryptocurrency surpassed the mid-term holder breakeven, suggesting that a new rally could be imminent.
From a technical analysis standpoint, BTC has recently shown a Golden Cross, a rare bullish indicator that crypto analysts predict could lead to a potential price increase of 100%. Currently, BTC is trading at $114,601, reflecting a 0.9% decrease in the last 24 hours.

Featured image from Unsplash, charts from CryptoQuant and TradingView.com

