The price of Bitcoin has dropped below $110,000, hovering just above $109,000. This decline coincides with the Crypto Fear and Greed Index falling to 29, edging closer to Extreme Fear levels.
Summary
- The Crypto Fear and Greed Index has decreased by 16 points in the last 24 hours to 29, indicating that the market is officially in a state of Fear as it approaches Extreme Fear territory.
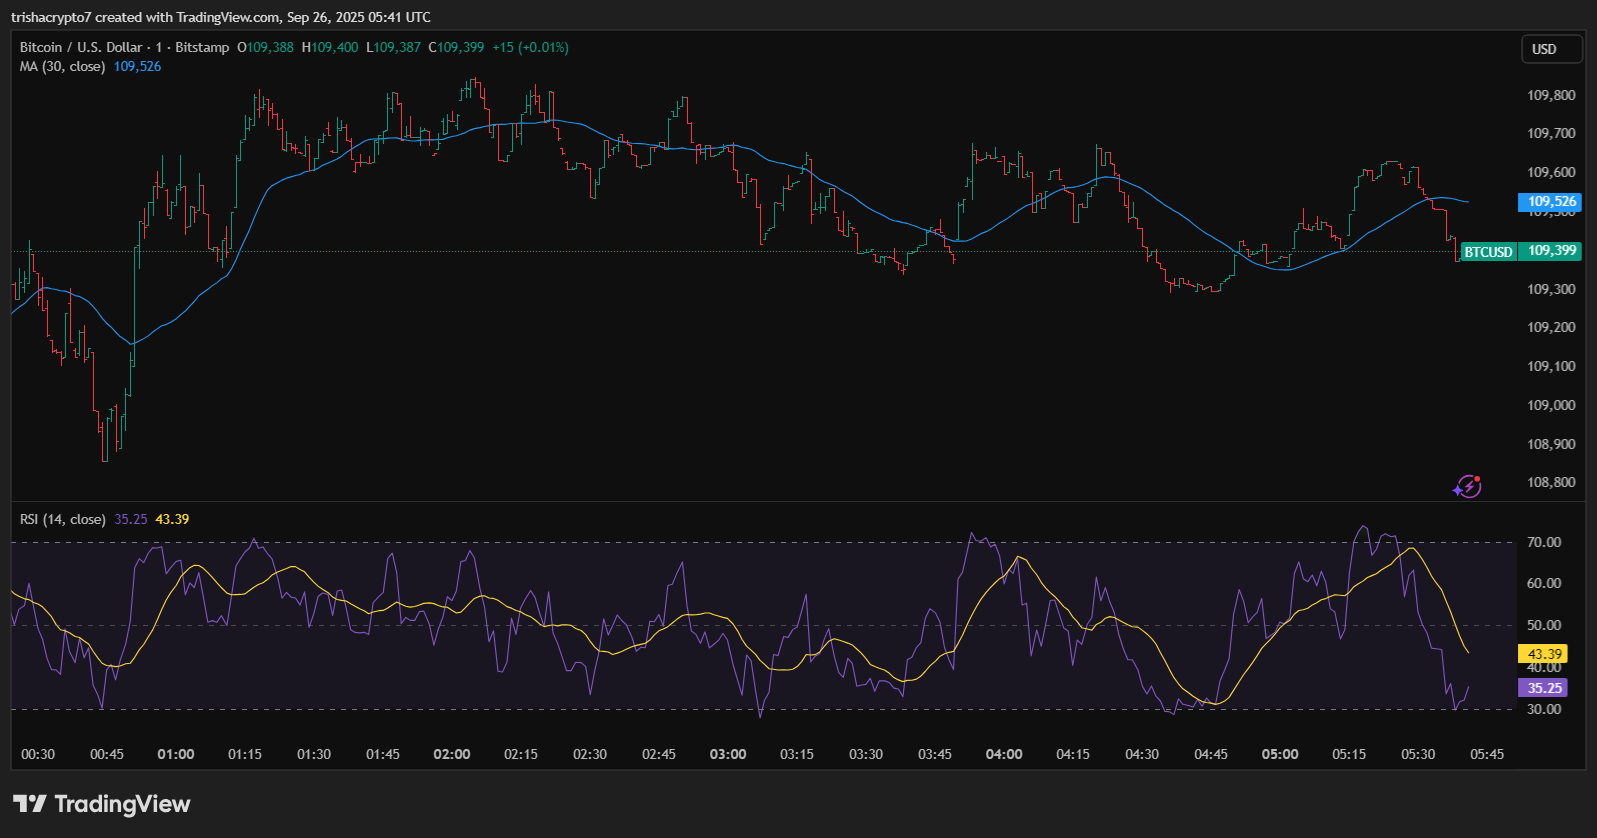
- Bitcoin has dropped by 2.1%, falling to approximately $109,399.
- If BTC can surpass the 30-day moving average at $109,526, it may trigger a rebound and a retest of the $109,700 to $109,800 range.
Data from CoinGlass shows that the Crypto Fear and Greed Index has declined by 16 points from the previous day as Bitcoin continues its sharp descent. The index signals that the crypto market is currently experiencing Fear following a wave of market liquidations and significant losses among major tokens.
The last occurrences of the Crypto Fear and Greed Index falling into Extreme Fear were in April 2025 and mid-February 2025, right after former President Donald Trump announced extensive tariffs that rattled the crypto market.
As of September 26, the overall cryptocurrency market capitalization has decreased by 2%, stabilizing around $3.8 trillion. The market has yet to recover from the mass liquidations that occurred earlier this week when it fell below $4 trillion as a result of a series of long positions being liquidated.
Both Bitcoin (BTC) and Ethereum (ETH) have seen declines of about 2%. Ethereum has again fallen below the $4,000 mark, while Bitcoin has suffered a significant drop below $110,000.
At the time of reporting, Bitcoin has managed to maintain a price above $109,000 despite an earlier drop to $108,787 today. However, it has not been able to recover to pre-liquidation levels which were above $117,000.
Bitcoin price analysis: How low can it fall?
Currently, BTC is trading at $109,399, demonstrating some weakness after a minor rebound. The price is trading below the 30-period moving average of approximately $109,526, indicating short-term bearish momentum.
As the moving average serves as a resistance zone, Bitcoin may find it challenging to rise in the short term unless buying volume increases significantly to push it higher.
BTC’s Relative Strength Index is around 35, approaching oversold territory. This suggests the asset is under short-term selling pressure, yet it could also indicate that a potential relief bounce might occur if buyers consider this an appealing entry point.

However, with the RSI still trending downward, the bearish momentum has not fully dissipated, meaning Bitcoin may continue to test lower levels before finding stabilization.
If the bearish trend persists, traders might see BTC dropping further to the support range of $109,200 to $109,000, which has historically provided short-term stability during intraday declines. A decisive break below $109,000 could lead to a sharper correction, potentially targeting $108,800.
Conversely, there remains potential for a rebound. If Bitcoin can stay above $109,200 and the RSI begins to reverse upward, the asset might see a bounce toward the $109,500 to $109,600 area. For a more robust recovery, BTC would need to reclaim and hold above the 30-period MA at $109,526, which could facilitate a retest of the $109,700 to $109,800 zone.

