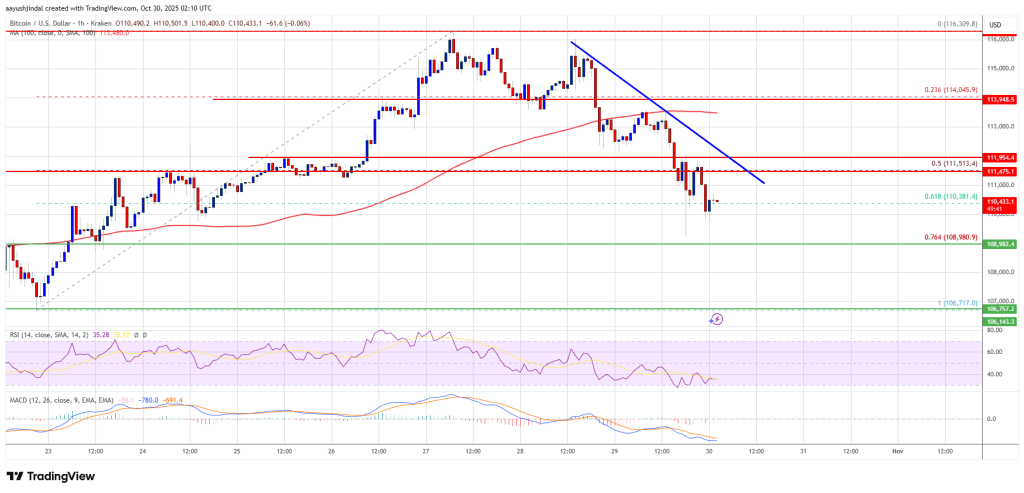
The price of Bitcoin is experiencing a correction, moving below $112,500. BTC may continue its downward trend if it remains beneath the $112,000 resistance level.
- Bitcoin has initiated a downward correction, falling below the $112,000 support.
- The price is currently trading below $112,000 and the 100-hour Simple Moving Average.
- A bearish trend line is forming, with resistance at $111,500 on the hourly chart for the BTC/USD pair (data sourced from Kraken).
- If the pair continues trading below the $108,800 zone, further declines are likely.
Bitcoin Price Decline Continues
The price of Bitcoin struggled to maintain its position above the $113,500 pivot point, leading to further losses. BTC fell below the $112,500 and $112,000 thresholds, entering a bearish phase.
This decline resulted in the price dipping below the 61.8% Fibonacci retracement level of the upward move from the $106,718 swing low to the $116,310 high. Additionally, a bearish trend line is forming with resistance at $111,500 on the hourly BTC/USD chart.
Currently, Bitcoin is trading below $112,000 and the 100-hour Simple Moving Average. Should bulls attempt a rebound, they may encounter resistance near the $111,500 level and the trend line. The initial key resistance lies around the $112,000 mark.

The next resistance level might be at $112,500. A close above this resistance could push the price higher. In that scenario, the price may rise to test the $113,200 resistance. Additional gains could bring the price towards the $113,500 level, with subsequent barriers for bulls at $115,000 and $115,500.
Further Losses for BTC?
If Bitcoin is unable to surpass the $112,500 resistance area, it may continue its downward trajectory. Immediate support is found around the $110,000 level, with major support at approximately $108,800, or the 76.4% Fibonacci retracement level of the upward move from the $106,718 swing low to the $116,310 high.
The next support zone is around $108,000. Additional losses could push the price toward $106,500 in the near term. The principal support lies at $103,500, below which BTC may find it difficult to recover in the short run.
Technical indicators:
Hourly MACD – The MACD is currently gaining momentum in the bearish zone.
Hourly RSI (Relative Strength Index) – The RSI for BTC/USD is now below the 50 mark.
Major Support Levels – $108,800, followed by $108,000.
Major Resistance Levels – $111,500 and $112,000.

