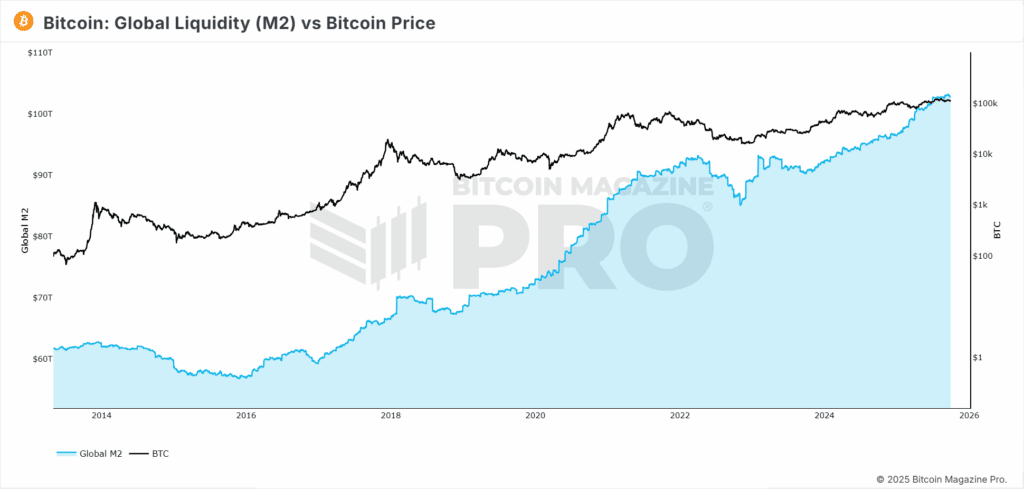
The price of Bitcoin has been moving sideways for several months, but liquidity indicators that have closely followed this cycle are suggesting a shift is on the horizon. Key factors such as Global M2, stablecoin supply, and correlations with Gold are indicating that BTC is accumulating pressure for its next upward movement.
Global M2 and Bitcoin’s Price Dynamics
The global M2 money supply has historically maintained a strong association with Bitcoin trends. The expansion of M2 tends to align with bull markets, while stagnation or contraction has typically coincided with periods of sideways movement and declines. In recent months, growth in Global M2 has decelerated, correlating with Bitcoin’s stagnant price behavior after reaching an all-time peak of around $124,000. Historically, when Global M2 begins to increase again, it’s often funneled into speculative assets like Bitcoin, which usually reaps significant benefits.

Stablecoin Supply’s Impact on Bitcoin Price Movements
The supply of stablecoins within the crypto space has proven to be a more reliable indicator than Global M2. The correlation with BTC has surpassed 95%, and year-over-year alignment remains nearly perfect. When the rate of stablecoin supply growth exceeds its 90-day moving average, it historically signals an opportune time for accumulating Bitcoin ahead of robust price rallies. Conversely, contractions in supply have aligned with weak market periods.
Gold Correlations and Bitcoin Price Stability
In 2025, Bitcoin has shown a close relationship with Gold, typically with about a 40-day lag, achieving over a 92% correlation. Gold’s continual ascent to new all-time highs this year has provided supportive momentum for BTC, which often responds as investors begin to prefer more stable and speculative assets. If this trend persists, BTC might experience a breakout towards $150,000 in early November.
US Dollar Strength vs. Bitcoin Pricing Trends
While liquidity indicators and Gold correlations appear bullish, the US Dollar Strength Index has been indicating a contrary trend. Bitcoin generally trades inversely to the dollar, and the DXY has seen recent rebounds. Over the past year, the inverse correlation has been around minus 40%. This suggests that some short-term fluctuations or downward pressure may persist, even as the broader trend supports higher prices.
The convergence of Global M2, stablecoin supply, and Gold correlations signals that BTC is nearing a significant breakout, with the seasonal trends in Q4 further supporting the bullish outlook. However, the conflicting signals from the dollar remind us that sideways trading and false starts are common in every cycle. Historically, Bitcoin has undergone prolonged consolidations before surges, and current indicators imply we might be approaching such a moment.
For a deeper analysis on this subject, check out our latest YouTube video here:
Bitcoin Is PERFECTLY Following THIS Data Point
For extensive data, charts, and expert insights into Bitcoin price trends, head over to BitcoinMagazinePro.com.
Subscribe to Bitcoin Magazine Pro on YouTube for more expert market insights and analyses!

Disclaimer: This article is intended for informational purposes only and should not be taken as financial advice. Always conduct your own research before making investment decisions.

