The stock price of Strategy has plummeted beneath a critical support level as Bitcoin dropped below $110,000, with its mNAV multiple hitting a year-to-date low.
Summary
- The stock price of MSTR has fallen below a significant support level.
- There is a potential for a death cross pattern to form soon.
- Bitcoin has exhibited a head-and-shoulders pattern on the daily chart and a rising wedge on the weekly chart.
On Thursday, Strategy’s stock traded at $297, marking its lowest point since April and sitting 35% below its all-time high. This decline has reduced its market capitalization from a year-to-date peak of $129 billion to $84 billion.
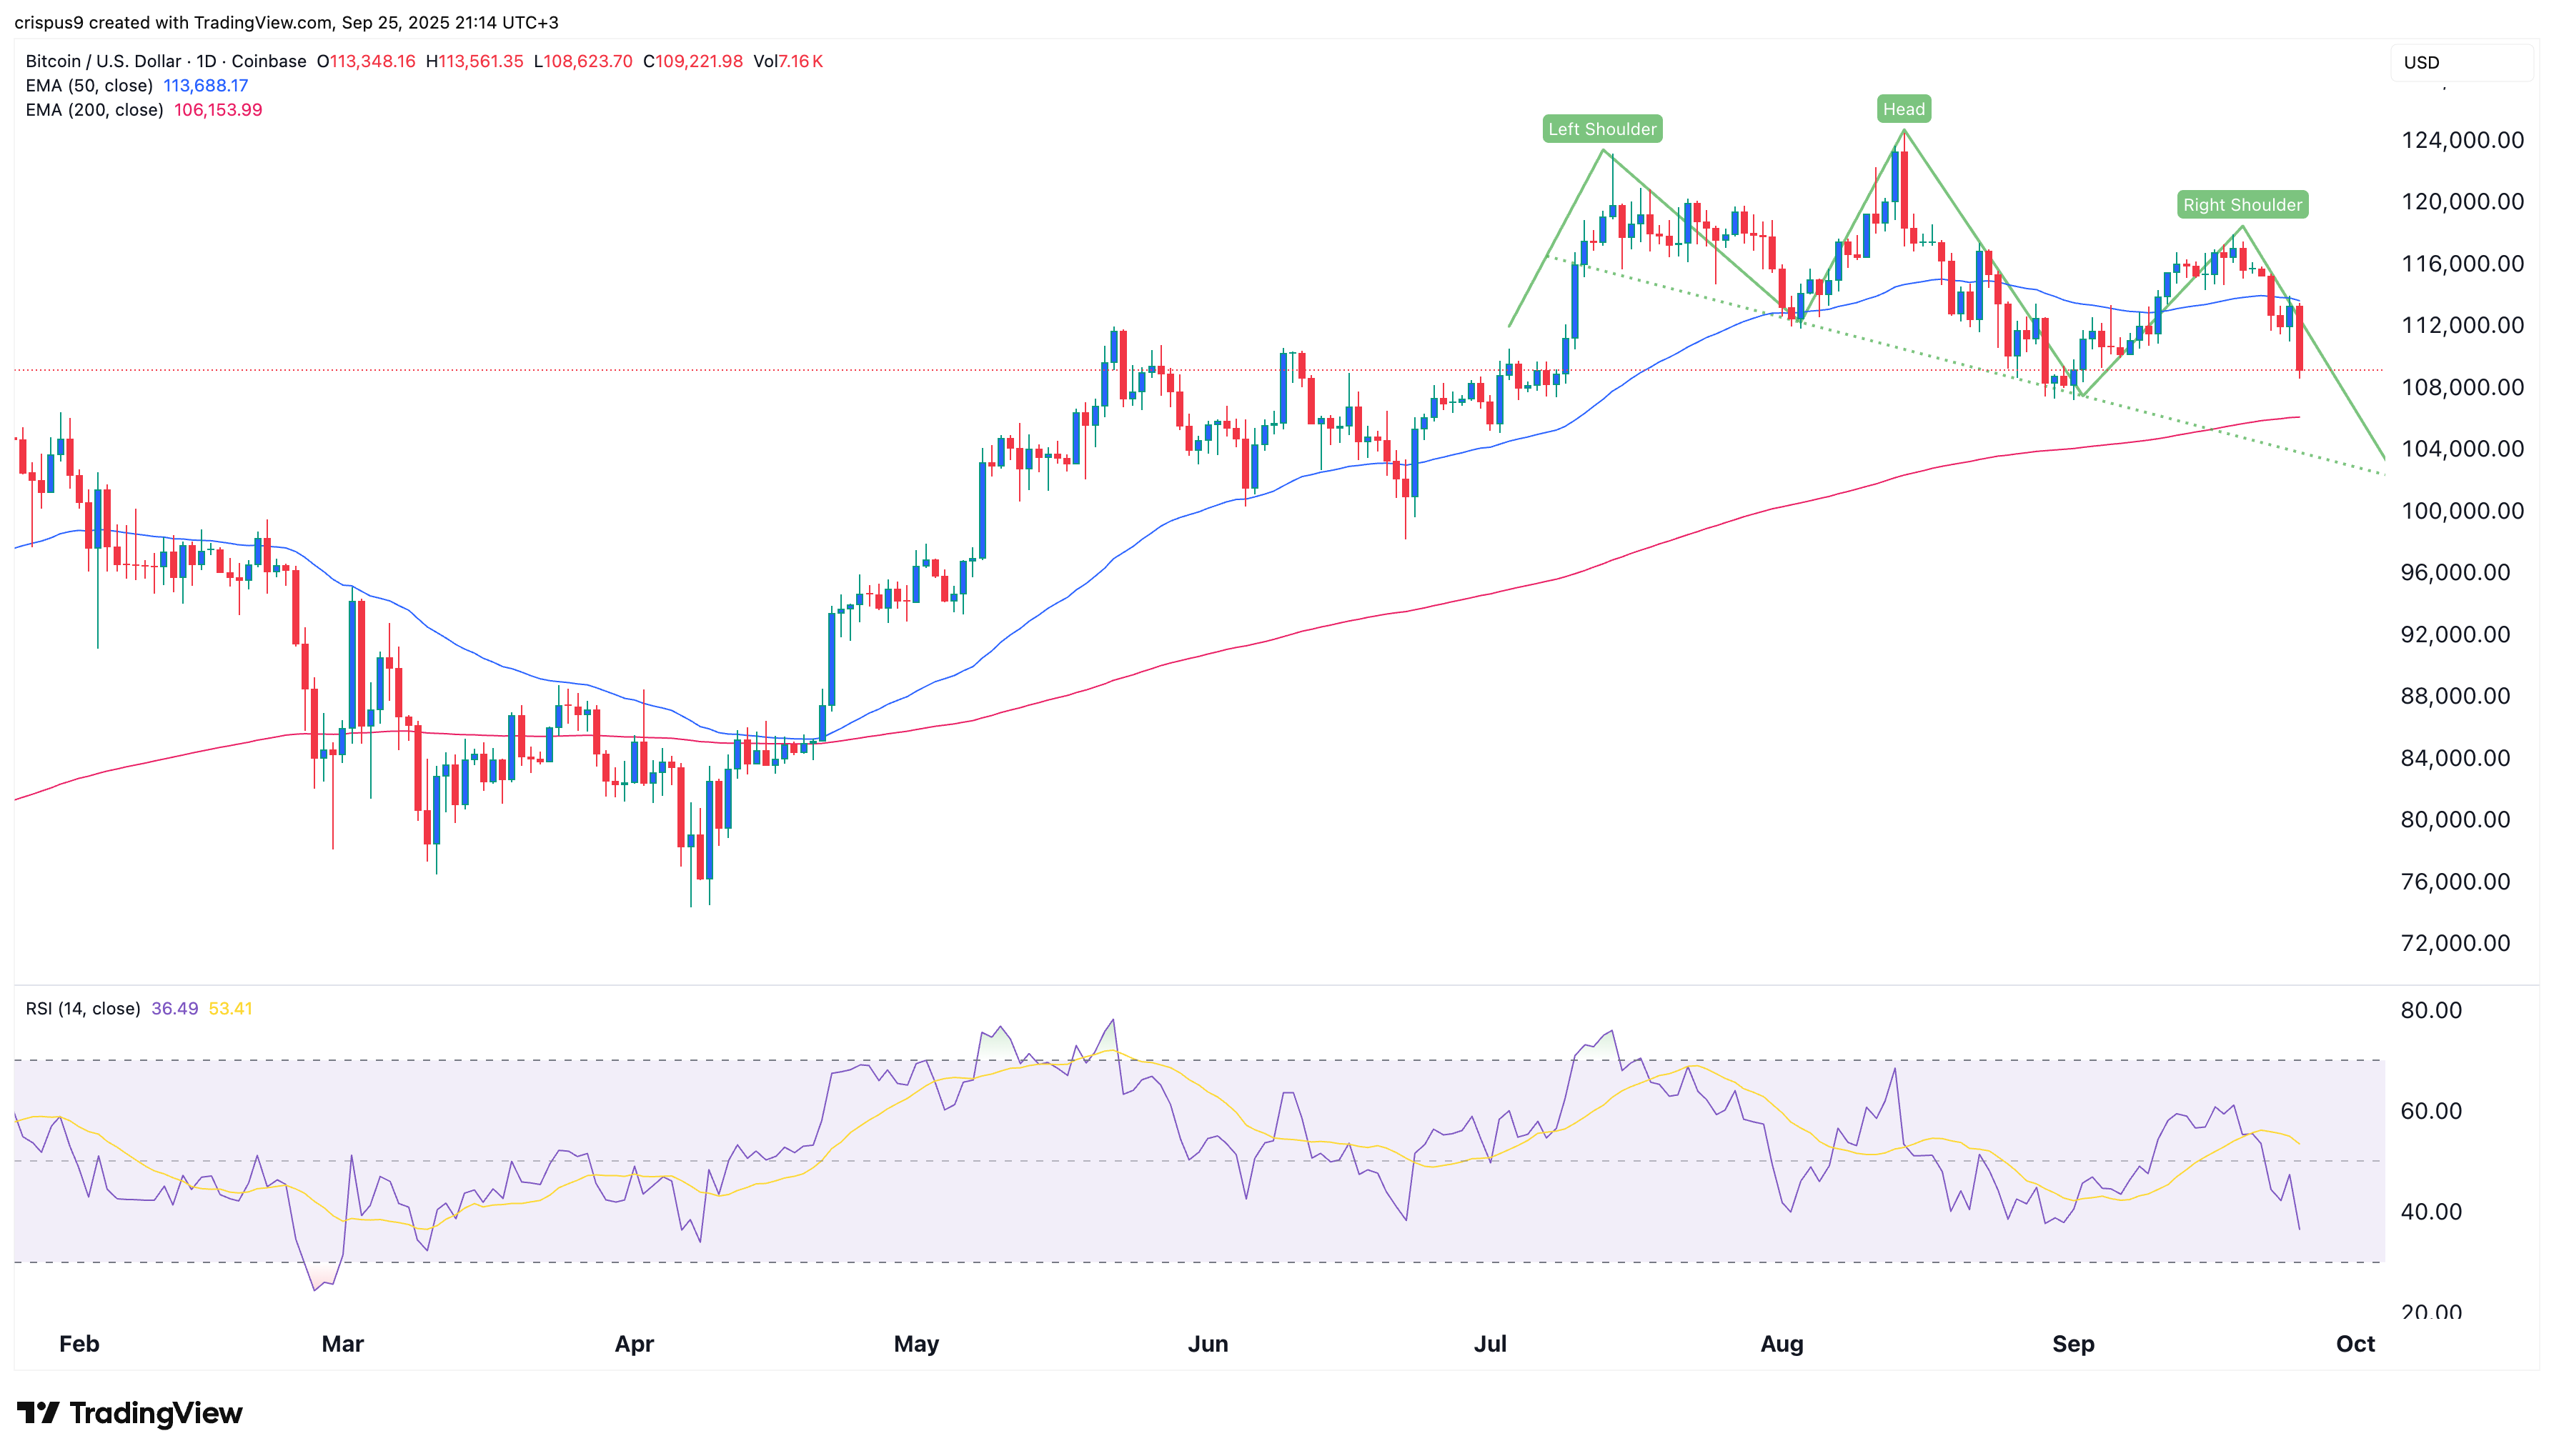
MSTR’s stock has suffered amidst the ongoing cryptocurrency market downturn. Bitcoin (BTC) fell below $110,000 for the first time since September 1. As illustrated in the chart below, it has developed a head-and-shoulders pattern, indicating potential further declines ahead.

Additionally, Bitcoin has formed a substantial rising wedge on the weekly chart, suggesting that we may be entering a lengthy bear market.
A prolonged decline in Bitcoin’s price could be detrimental for Strategy, which has established itself as the largest global holder of Bitcoin. Currently, it possesses 639,835 coins valued at $69 billion. If Bitcoin were to reach its all-time high of $124,200, those coins would be worth $80 billion.
Crucially, the declining price of Bitcoin signifies that the company’s premium has experienced a sharp decline. The closely monitored mNAV multiple has fallen to a year-to-date low of 1.195, a drop from the November high of 3.4.
This diminishing mNAV multiple poses a risk for the company since it relies on its premium to raise capital for Bitcoin purchases. For a significant period, Saylor maintained that he would not issue shares if the mNAV fell below 2.5; however, he revised this stance in August, allowing for potential dilution.
Technical Analysis of MSTR Stock Price

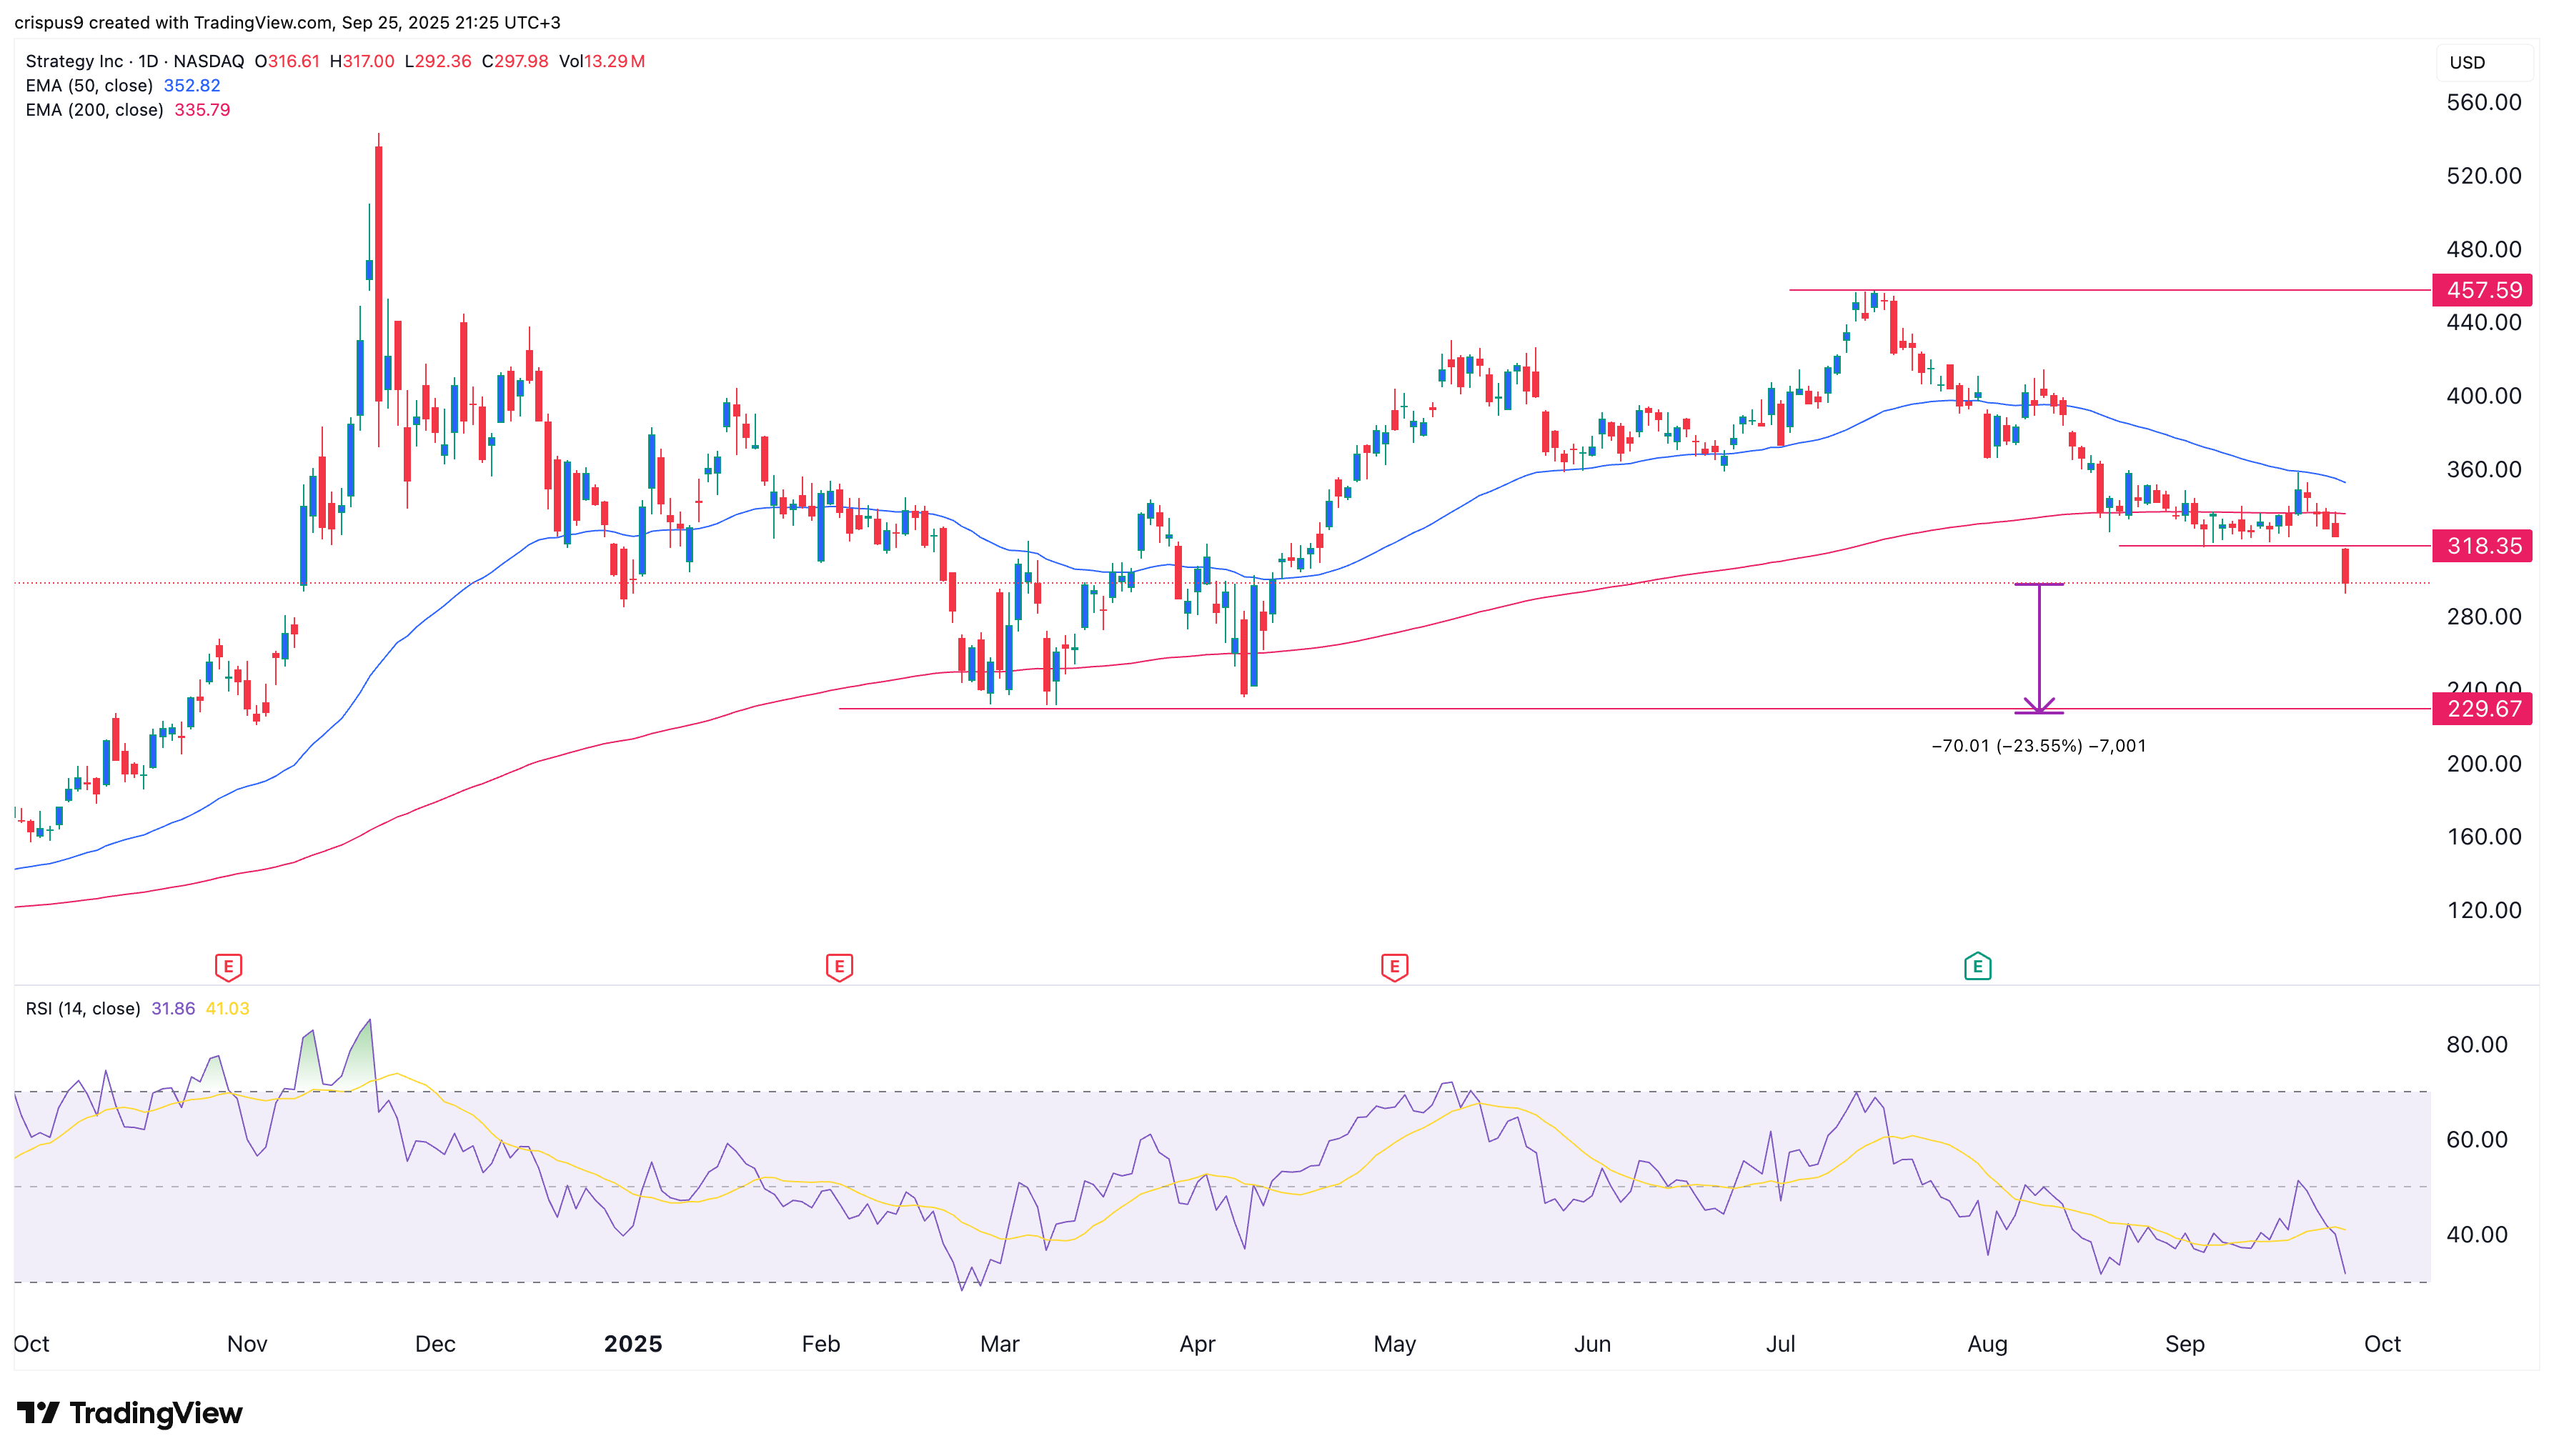
The daily chart indicates that MSTR’s stock price has dropped from a high of $457 in July to $295 today.
It has slipped beneath a crucial support level at $318, which had previously held firm multiple times this month.
Moreover, the stock appears poised to form a concerning death cross pattern, as the gap between the 50-day and 200-day Exponential Moving Averages has diminished.
A death cross could trigger further declines, potentially targeting the key support level at $230, its lowest level in April of this year. This target represents a drop of about 25% from the current level.

