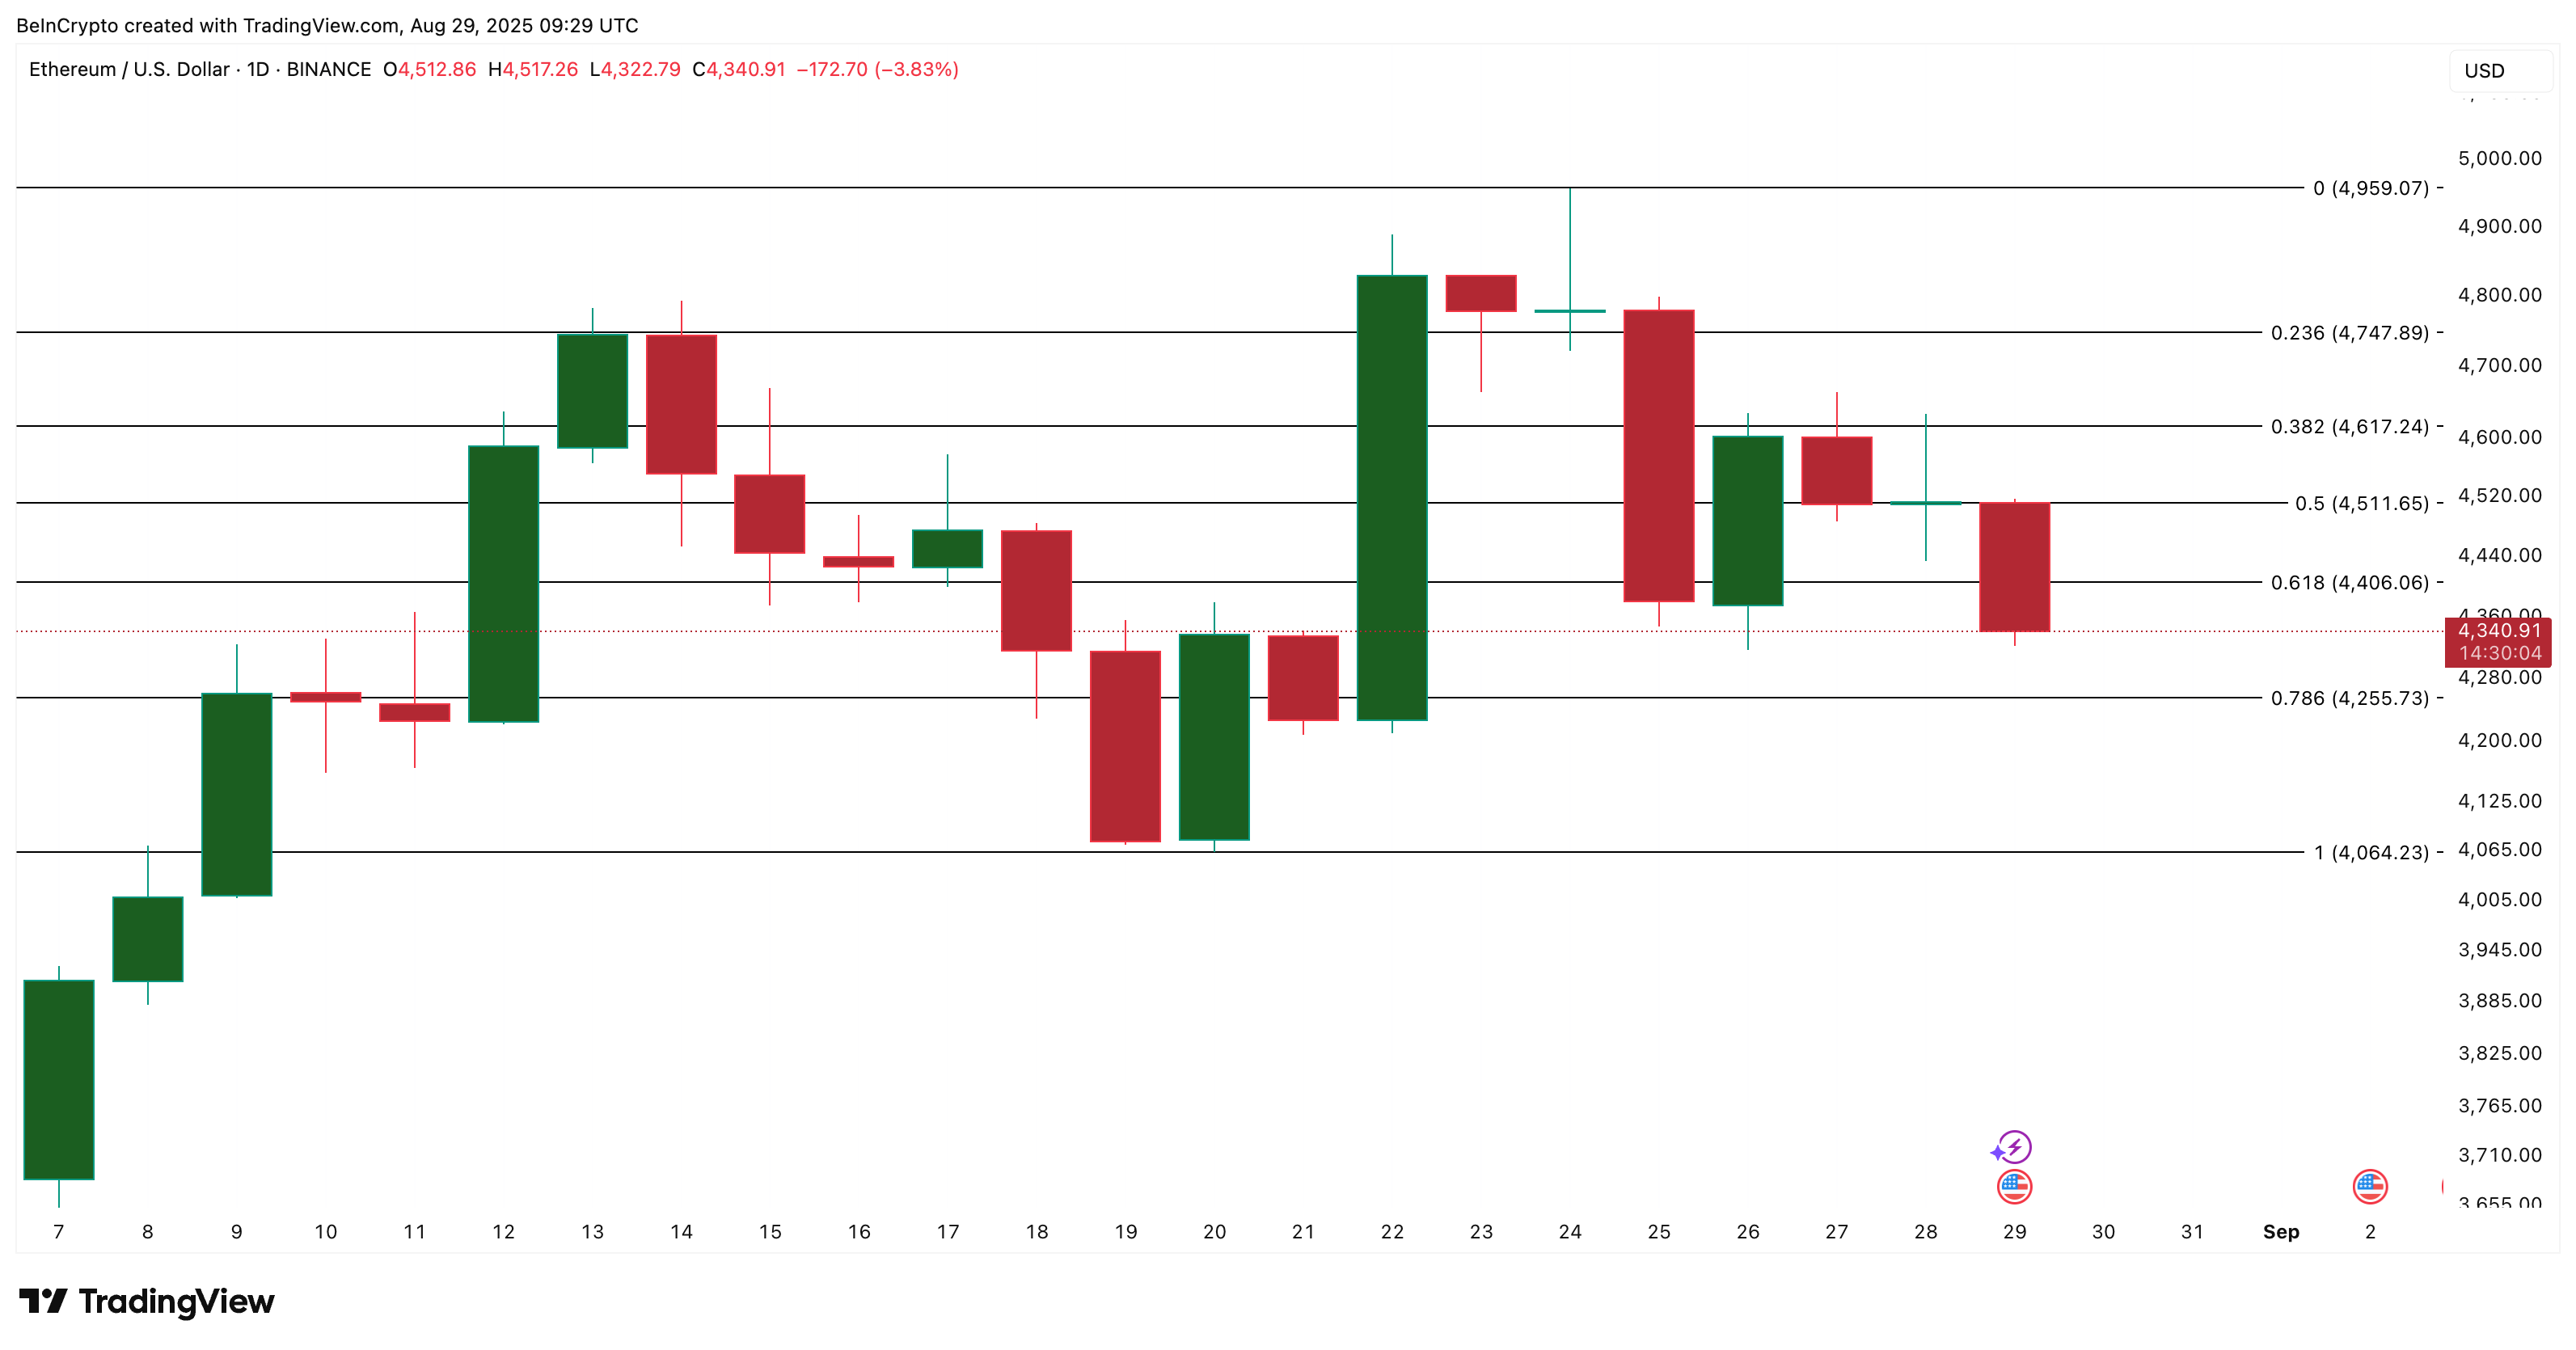
The price of Ethereum has dropped over 5% today, trading around $4,300, marking one of its most significant daily declines in recent weeks. However, it maintains a monthly gain of over 13%, indicating that the overall upward trend remains intact.
The key question now is whether this dip is merely noise or the beginning of a more substantial decline. On-chain and technical indicators suggest that the downturn may be temporary, as profit-taking subsides and whales begin to re-enter the market.
Profit Taking Eases As Whales Add $1 Billion ETH
The Spent Coins Age Band, which measures the sale of long-held coins, has fallen to its lowest point in a month at approximately 135,000 ETH. This indicates that long-term holders are selling less; profit-taking has noticeably decreased compared to earlier in August, when the figure surpassed 525,000 ETH—a 74% decrease.

Historical data indicates that when this metric reaches a low point, Ethereum often experiences a rebound. For instance:
- On July 7, spent coins declined to 64,900 ETH, and the Ethereum price surged from approximately $2,530 to $3,862—a 52% increase.
- On August 17, a similar pattern resulted in a 20% rise, as ETH climbed from $4,074 to $4,888.
Currently, the recent drop back to local lows may indicate that the selling pressure is diminishing.
For token TA and market updates: Interested in more token insights like this? Sign up for Editor Harsh Notariya’s Daily Crypto Newsletter here.
Additionally, whales have been gradually purchasing during this dip. Addresses holding more than 10,000 ETH have increased their holdings from 95.76 million ETH on August 27 to around 96 million ETH now.

At current prices, this indicates that whales have added roughly $1 billion worth of ETH within just two days. The combination of decreasing profit-taking and renewed whale accumulation provides Ethereum with a solid foundation for a subsequent upward movement.
Ethereum Price Action and Liquidation Map Align At Key Levels
In addition to on-chain signals, chart patterns also support the bullish perspective. On the Bitget liquidation heat map, a buildup of short positions begins at $4,400, establishing this level as a crucial pivot point.
If ETH can close a daily candle above $4,406, it could trigger the liquidation of these short positions, compelling traders to buy back and consequently drive the Ethereum price higher.
Liquidation mapping illustrates where traders have taken substantial leveraged positions (both long and short) and the price points at which liquidations will occur.

On the downside, immediate support is located around $4,255, correlating with the $4,242 mark on the liquidation map. This is where the majority of leveraged long positions would be liquidated.
Thus, if the Ethereum price can maintain above $4,255, a reversal from the dip seems probable as the risk associated with leveraged downside diminishes.
If the ETH price dips below this point, the next critical level to watch is $4,064. Falling below this threshold could likely shift the trend to bearish in the short term.

The synchrony between liquidation clusters and price chart levels adds validity to these areas. It signifies that traders are closely monitoring the same figures, intensifying reactions at these levels.
For now, the plan is straightforward: maintain above $4,255 and reclaim $4,406 to bolster the case for a reversal. Failure to do so may place the Ethereum price at risk of further decline.
Disclaimer
This price analysis article is intended for informational purposes and should not be construed as financial or investment advice. BeInCrypto strives for accuracy, but market conditions can change abruptly. Always perform your own research and seek counsel from a professional before making any financial choices. Please be aware that our Terms and Conditions, Privacy Policy, and Disclaimers have been updated.

