In recent weeks, Ethereum’s price has entered a bear market, yet technical indicators and treasury acquisitions suggest a robust recovery may be on the horizon.
Summary
- This year, Ethereum’s price has retraced and entered a bear market.
- A bullish flag pattern has emerged on the daily chart.
As of Saturday, Ethereum (ETH) was trading around $3,860, showing a decline of more than 22% from its year-to-date peak of $4,965, though it increased by approximately 2.4% in the last 24 hours.
The price of Ethereum benefits from various fundamental and technical drivers set to enhance its performance. A major factor is that Tom Lee’s BitMine is persisting with its acquisition strategy.
This company added more coins this week, raising its total assets to over $6.6 billion. Lee remains optimistic about Ethereum’s future and indicated that BitMine would keep buying in the upcoming months.
SharpLink boasts a holdings of over 797k coins, and The Ether Machine has accumulated over 345k coins. Notably, Huobi’s founder has pledged to establish a $1 billion Ethereum treasury company.
Supporters claim Ethereum is a superior asset compared to Bitcoin due to its income-generating capabilities. According to data from StakingRewards, Ethereum offers a staking yield of 3%.
In addition, Ethereum ETFs outperformed those linked to Bitcoin (BTC). Reports indicate that these funds experienced outflows of merely $232 million this week, in stark contrast to Bitcoin, which saw its funds drop by over $1.2 billion.
The futures market indicates a potential Ethereum price recovery, as the funding rate has lingered above the neutral threshold. A positive funding rate suggests that investors expect the price to continue its upward trajectory.
Ethereum Price Technical Analysis

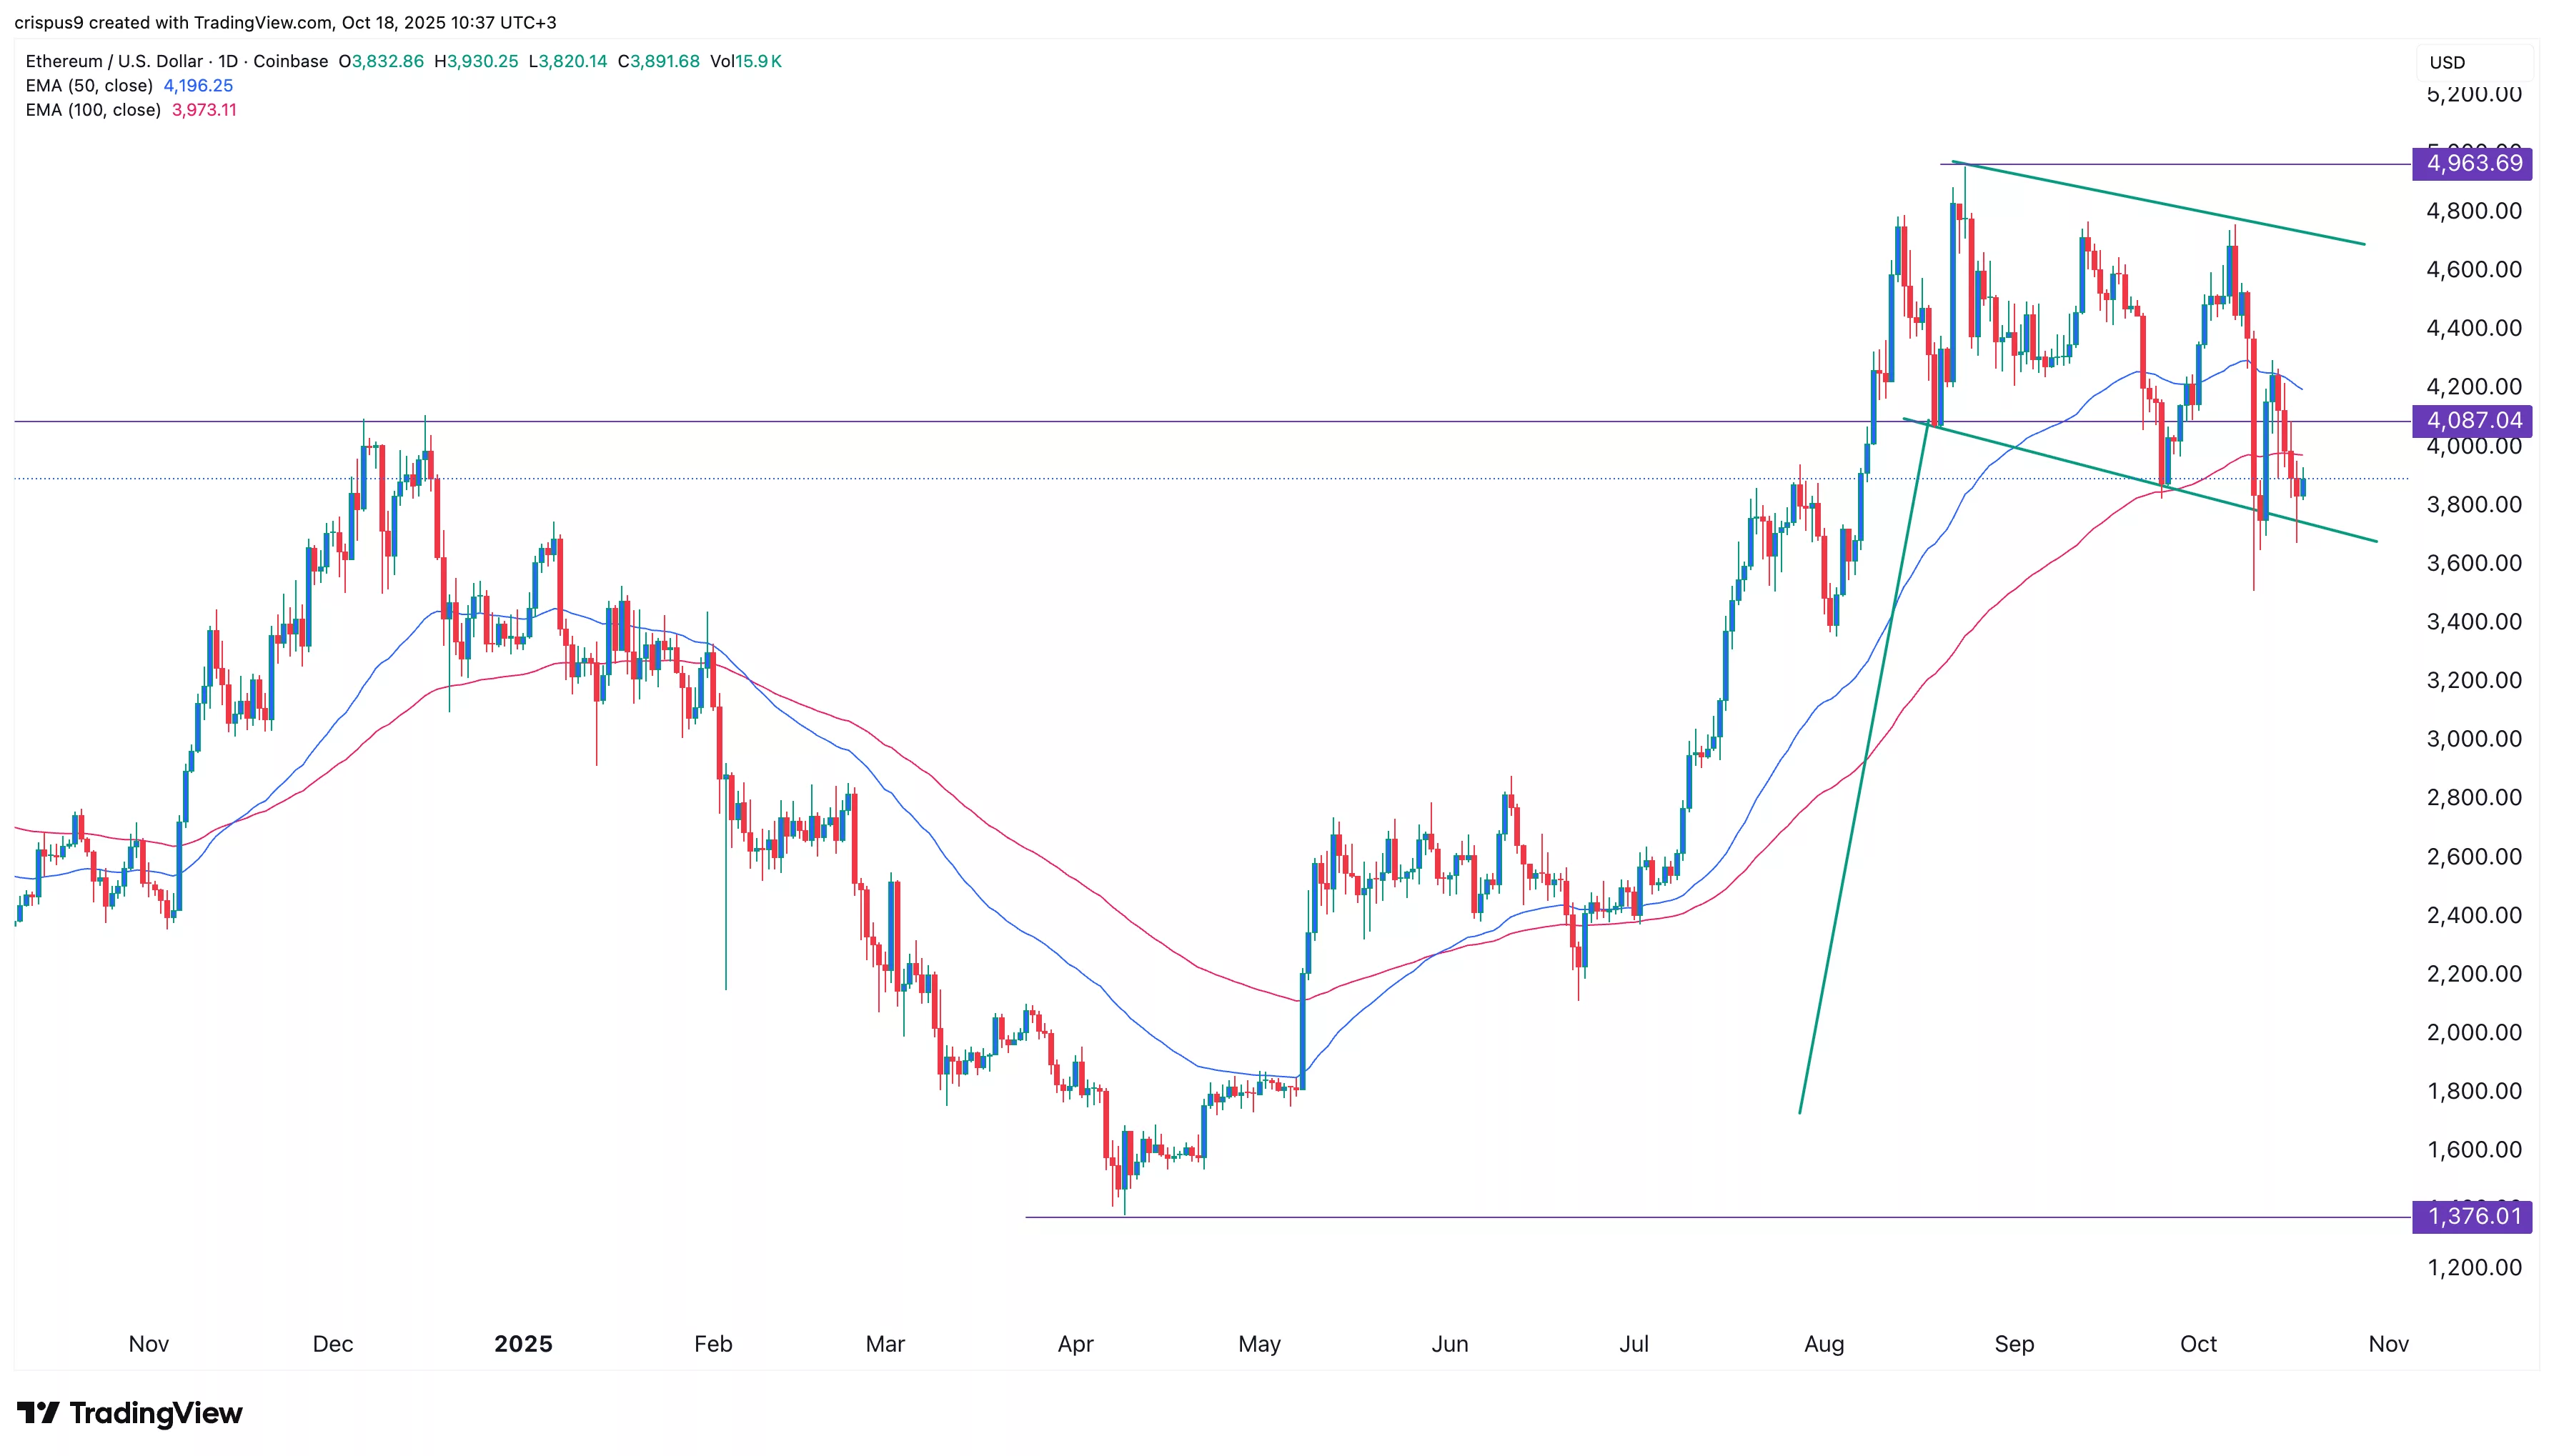
The daily timeframe chart reveals that ETH has declined in recent weeks, dropping from a high of $4,963 in August to approximately $3,900 today.
This decline has resulted in the price falling below both the 50-day and 100-day Exponential Moving Averages, as well as slipping slightly under the critical support level at $4,087, its peak from December of last year.
On a positive note, a bullish flag pattern has formed, characterized by a vertical line combined with a descending channel.
Consequently, Ethereum’s price could rebound in the weeks ahead. If this occurs, it may rally to retest its year-to-date high of $4,963, potentially reaching $5,000.
The bullish sentiment will persist as long as the price remains within the boundaries of the flag’s descending channel. Conversely, a breach below the lower part of the channel could indicate further declines, potentially down to $3,000.

