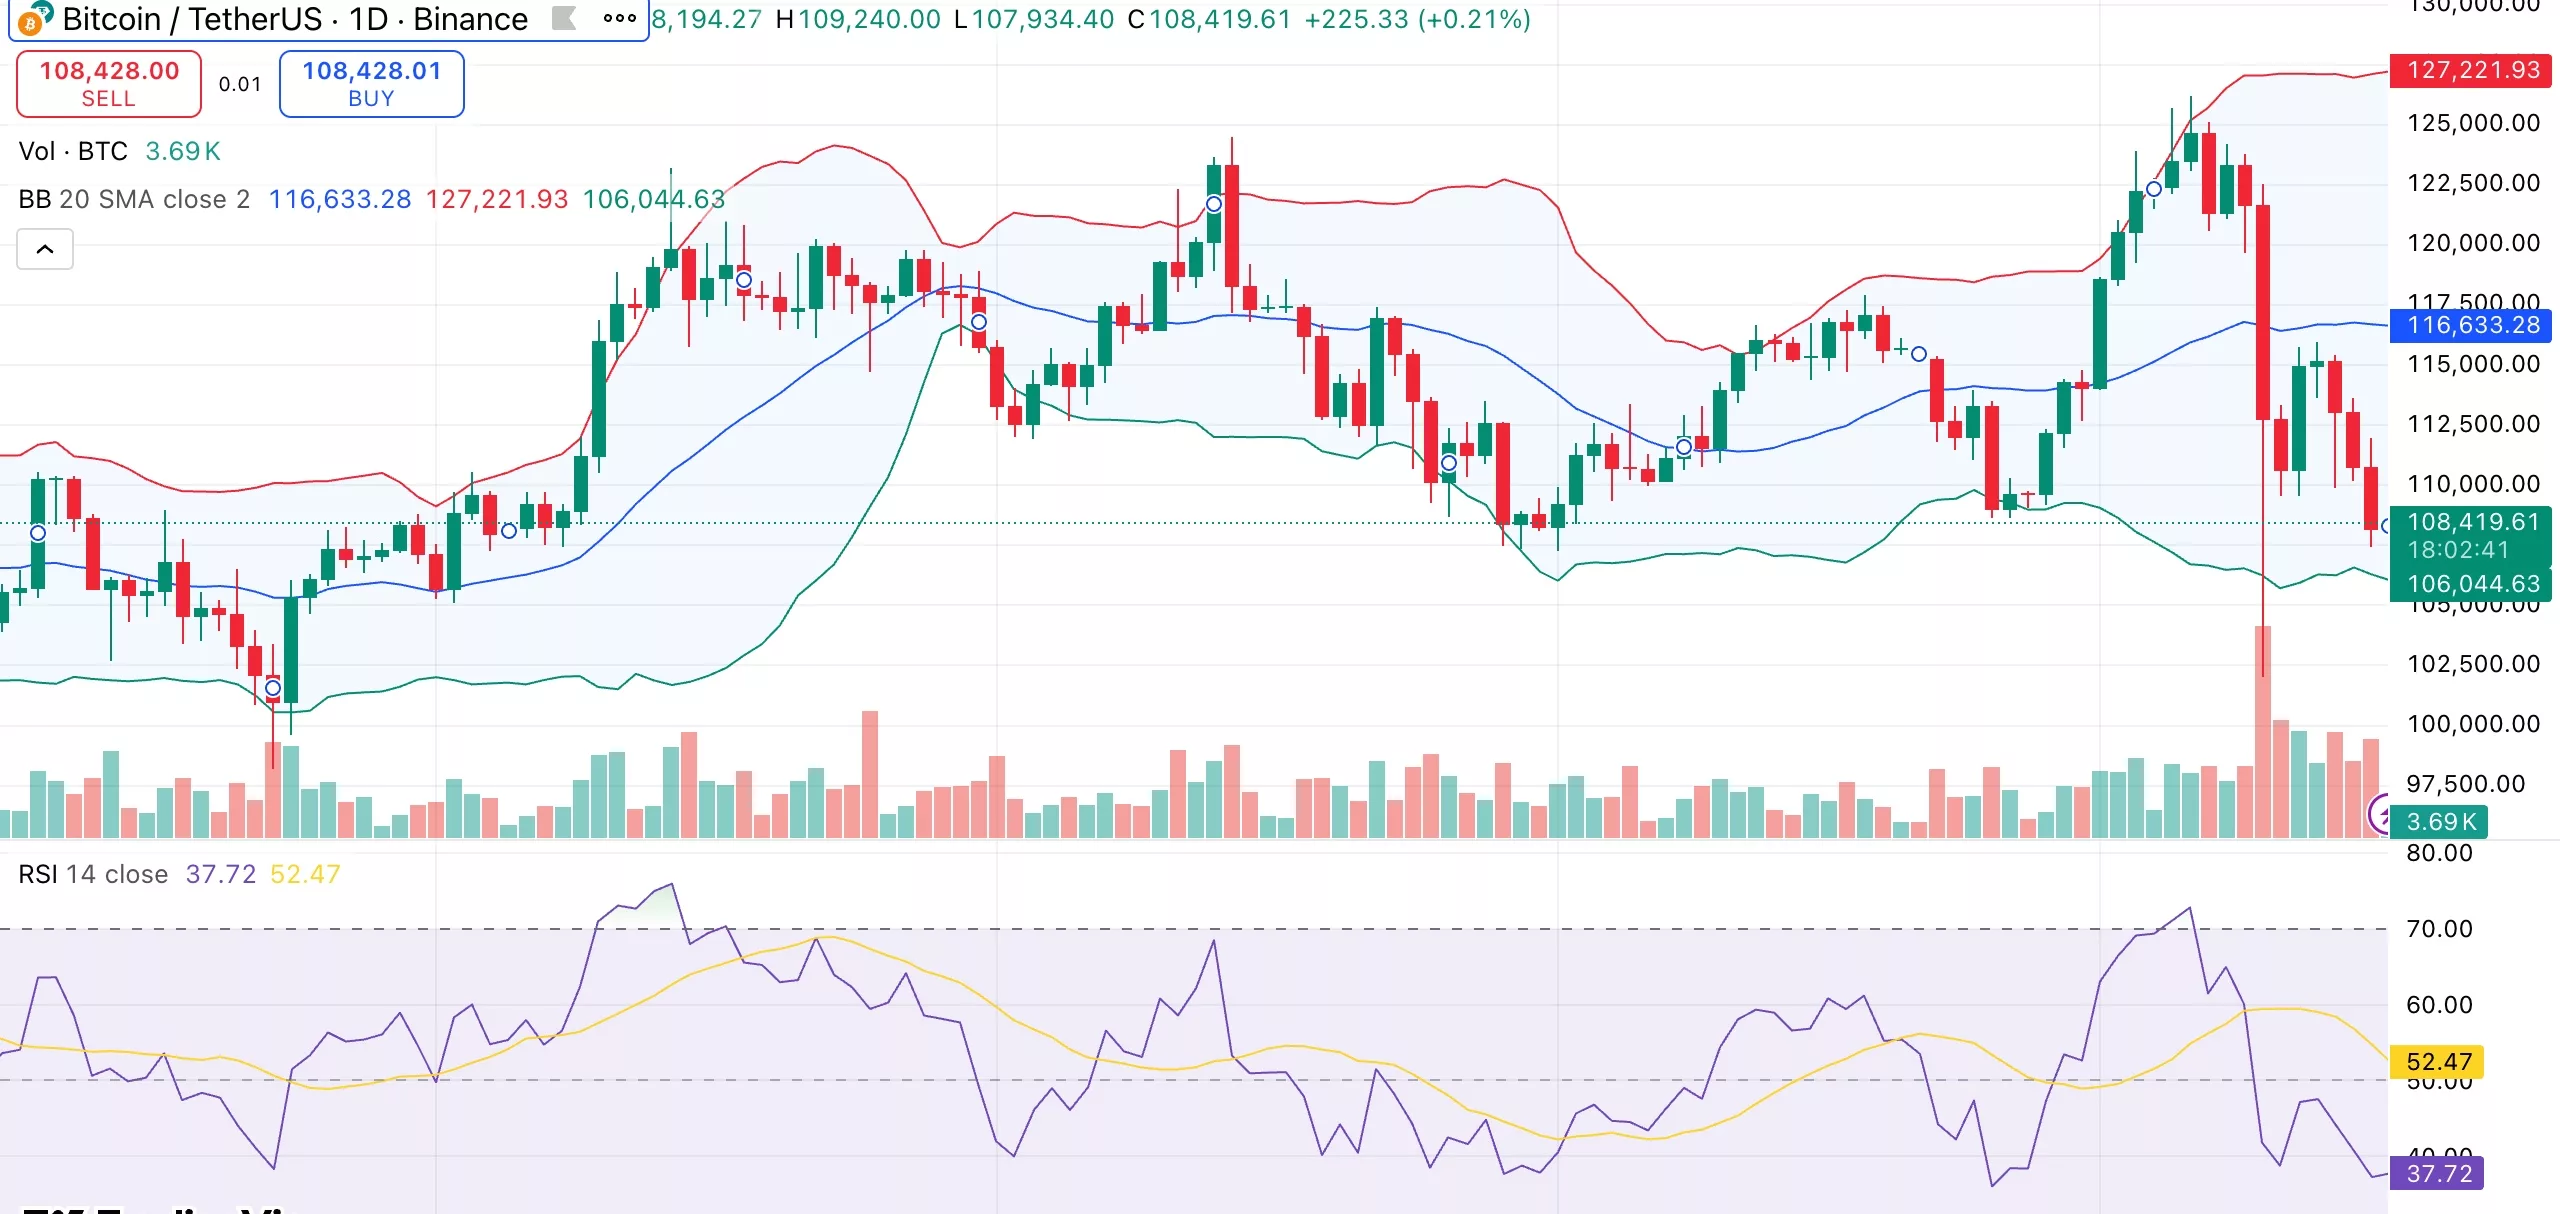
Bitcoin’s value fell below $110,000 as increasing exchange-traded fund outflows and renewed selling pressure pushed the market further into correction territory.
Summary
- Bitcoin declined beneath $110K as spot ETFs experienced $536M in outflows.
- Derivatives data reveal heightened caution, with volumes up by 40% but open interest remaining flat.
- Analysts caution that a drop toward $100K is possible if $108K support does not hold.
On October 17, Bitcoin traded lower, dipping below the $110,000 threshold to hit $108,420 at press time, representing a 2.4% decrease over the past 24 hours. The cryptocurrency has fallen 10% in the past week and 7% in the last month, currently sitting 14% below its all-time high of $126,080.
During this downturn, trading activity surged. Bitcoin’s (BTC) 24-hour trading volume increased by 25% to $83.1 billion, reflecting more activity as traders navigated key support levels.
According to CoinGlass, Bitcoin futures trading volume rose by 40% to $127.6 billion, while open interest remained steady at $72.8 billion. This indicates that traders are active yet cautious, adjusting their positions rather than making bold new investments.
Spot BTC ETF outlook
As per SoSoValue data, U.S. spot Bitcoin ETFs faced $536.4 million in outflows on October 16, marking their second consecutive day of withdrawals. ARK Invest’s ARKB led with $275 million in redemptions, followed by Fidelity’s FBTC with $132 million. Grayscale’s GBTC, BlackRock’s IBIT, and Bitwise’s BITB also reported smaller losses.
These ongoing outflows suggest that following Bitcoin’s recent spike, some institutions are scaling back their exposure or securing profits. Increased ETF redemptions typically generate short-term selling pressure, particularly when market sentiment is uncertain.
Bitcoin price technical analysis
The short-term technical outlook for Bitcoin is delicate. The relative strength index at 37 indicates neutral-to-weak momentum, while momentum shows a slight buy signal, suggesting that downside pressure may be easing.
However, every significant moving average, from the 200-day SMA ($107,535) to the 10-day EMA ($112,885), signals a sell, reflecting a consistent bearish sentiment.

Bitcoin is closely tracing the lower Bollinger Bands, with rising volatility indicating potential movement if support falters. The $108,000-$109,000 range has become a critical level to watch.
In the near term, Bitcoin may rebound toward the $113,000-$115,000 range if it maintains its current level. Conversely, a breakdown below could lead to a dip towards $104,000, potentially reigniting buyer interest.
If selling continues, analysts like Arthur Hayes predict a reasonable chance of a approach toward $100,000. Others speculate that prices may stabilize soon, given the consistent demand from long-term holders and ETFs.

