With the Bitcoin price dipping below the $110,000 support threshold, two concerning chart patterns have emerged alongside increasing exchange-traded fund (ETF) outflows.
Summary
- A head-and-shoulders pattern has developed in Bitcoin’s price chart.
- The weekly chart shows a rising wedge pattern for BTC.
- There has been a two-week decline in Bitcoin ETF inflows.
Bitcoin price declines amid ETF challenges
As of the latest update on Saturday, September 27, Bitcoin (BTC) was priced at around $109,600, marking a 12% decrease from its peak value. This represents its lowest point since September 2.
This week’s dip for BTC and other cryptocurrencies came as demand from American investors waned. Data from SoSoValue indicates a slowdown in ETF inflows over the last two weeks.
This week, Bitcoin ETFs saw outflows totaling $902 million, a stark contrast to the previous week’s inflow of $886 million, and down from $2.34 billion during the week of September 12.
Factors contributing to this weakness may include warnings from certain Federal Reserve officials regarding interest rate cuts. Officials such as Austan Goolsbee, Beth Hammack, and Raphael Bostic advised caution in reducing rates.
They highlighted that inflation has remained above the 2% target for more than four years and pointed out the continued strength of the labor market, as evidenced by low unemployment rates.
The economy has demonstrated resilience, with a recent report showing a 3.8% expansion in the second quarter. Notably, the number of Americans filing for jobless claims has significantly decreased over recent weeks.
Looking forward, the upcoming non-farm payroll data on Friday will be crucial for Bitcoin and other cryptocurrencies, as it will inform expectations regarding potential interest rate cuts during the October Fed meeting.
BTC price reveals head-and-shoulders pattern

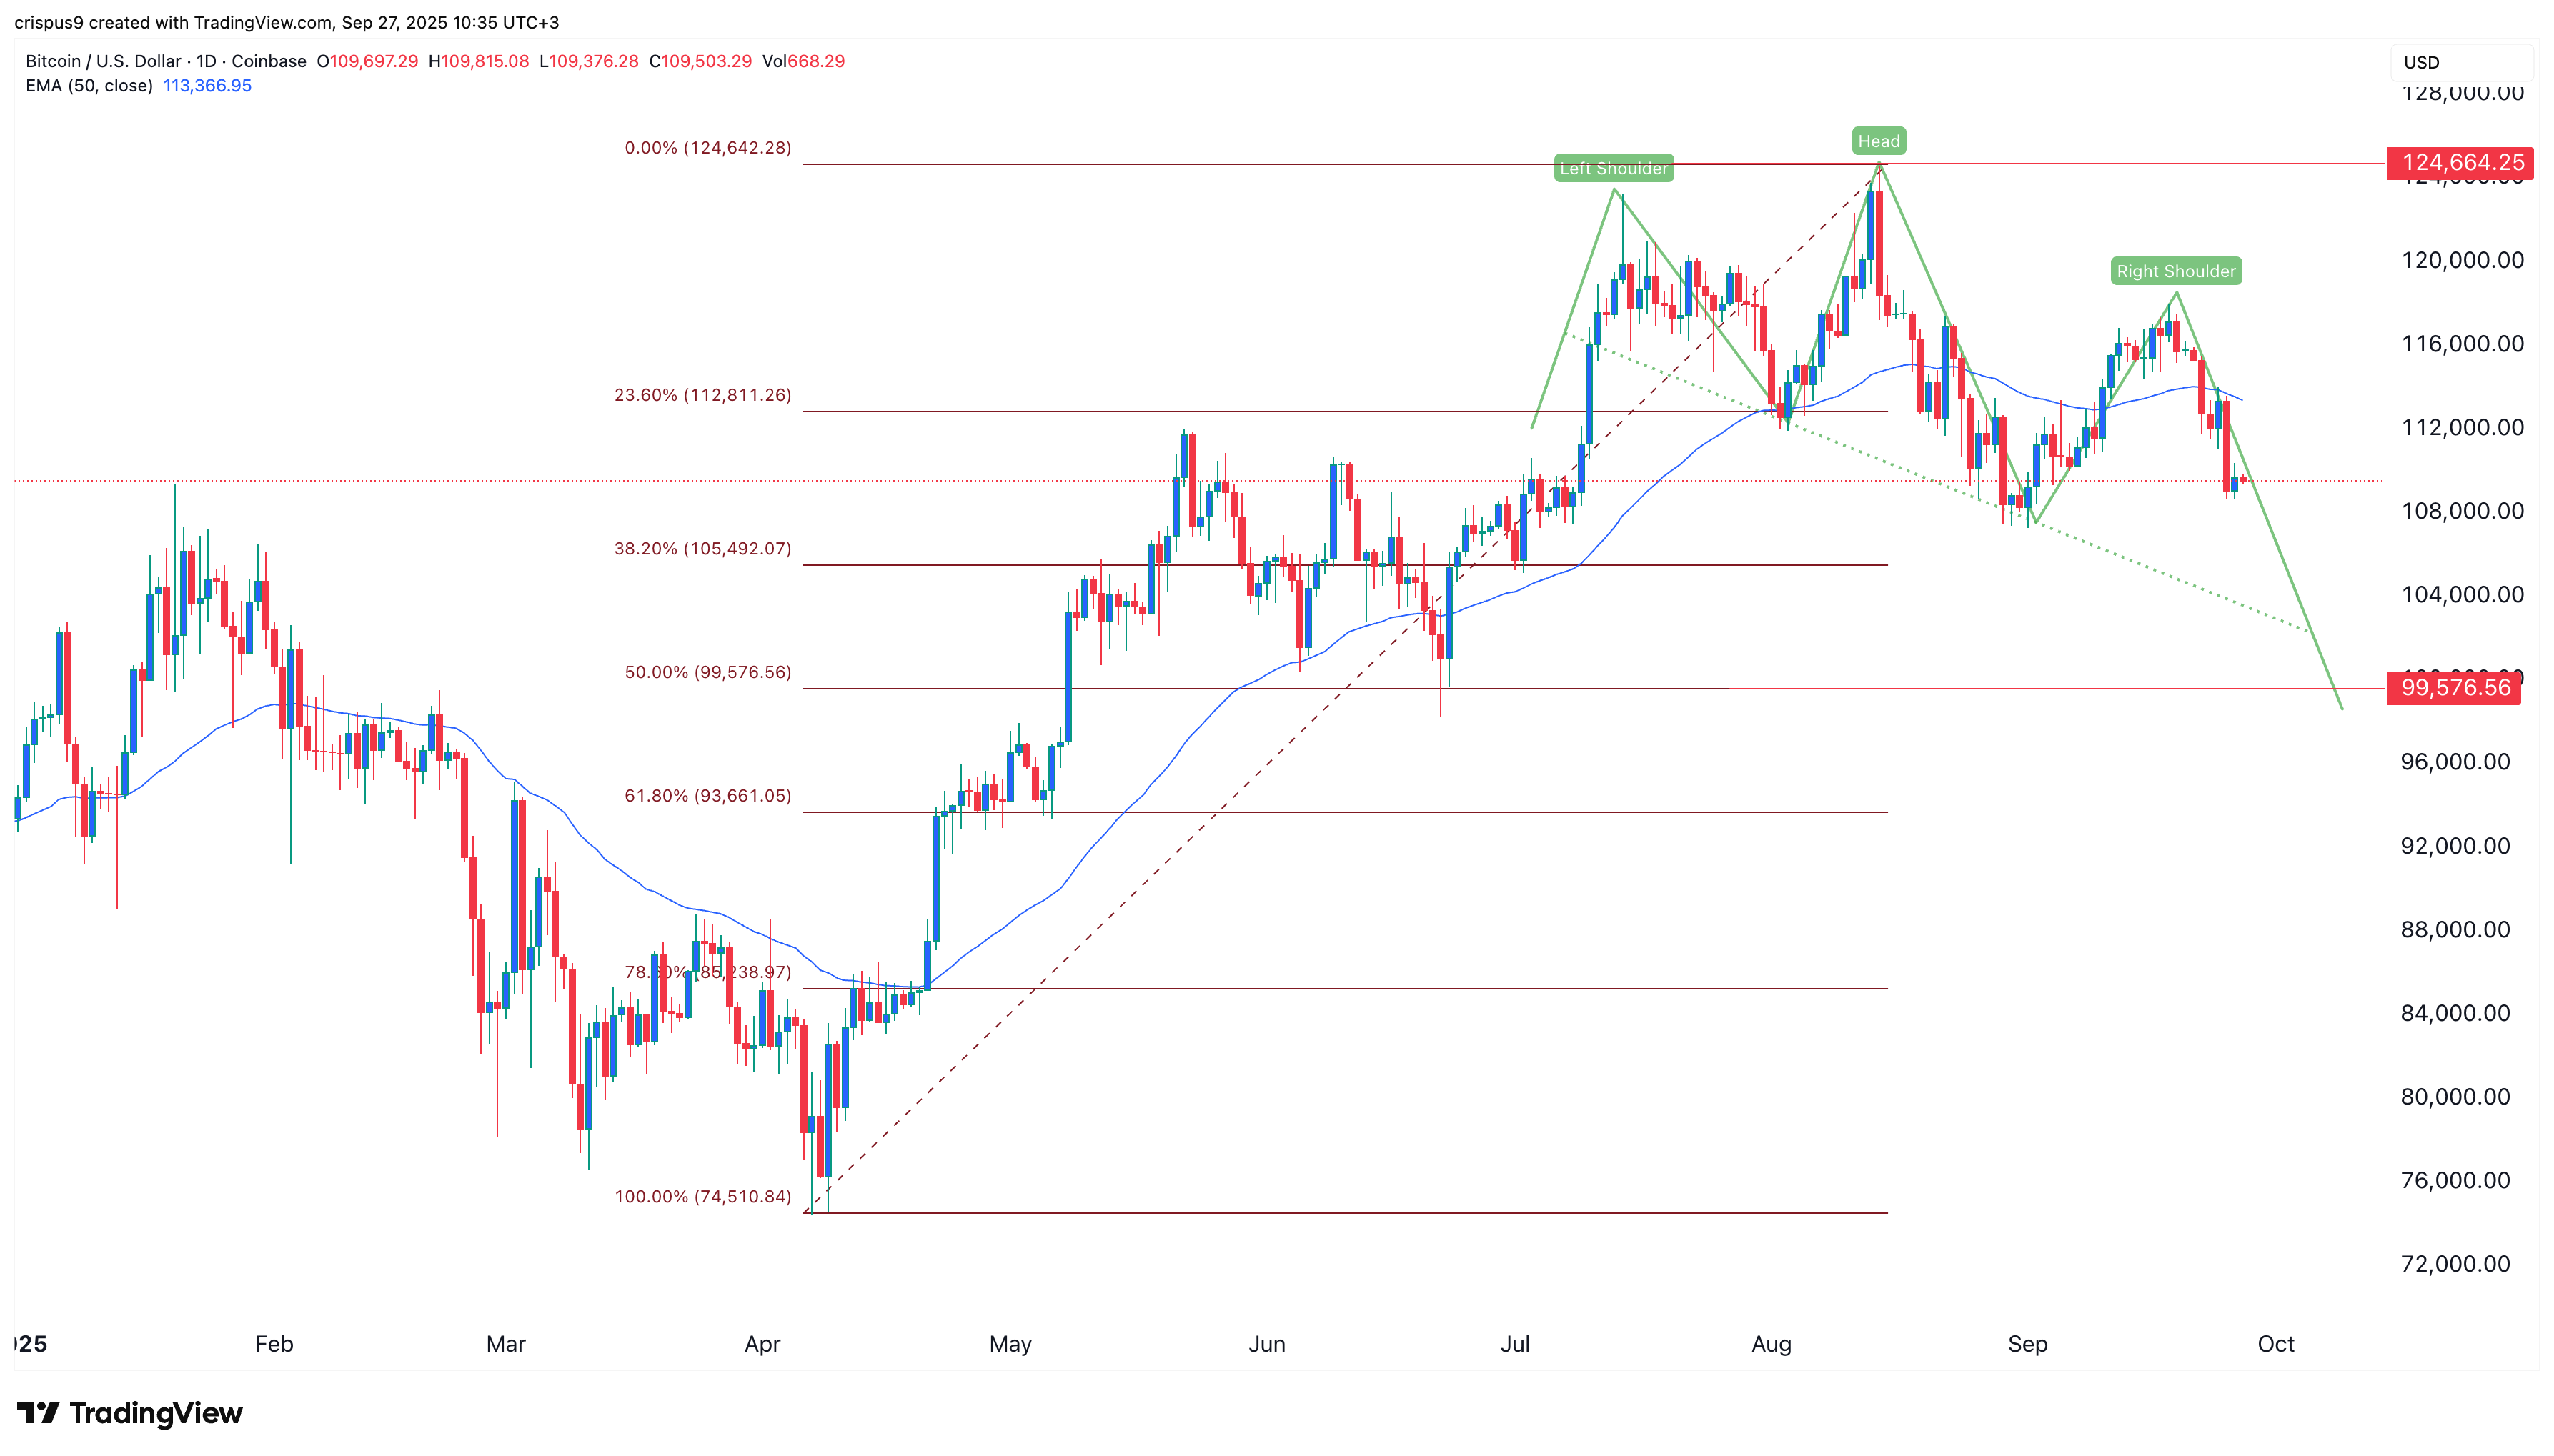
The daily timeframe chart indicates a pullback in Bitcoin’s price over the past few weeks. A closer examination shows the gradual formation of a head-and-shoulders pattern, typically signaling further declines.
Bitcoin has also dipped below the 50-day Exponential Moving Average, with the Relative Strength Index trending downward. These indicators suggest a further potential drop to the 50% Fibonacci Retracement level at $100,000.
BTC forms a rising wedge and shows bearish divergence

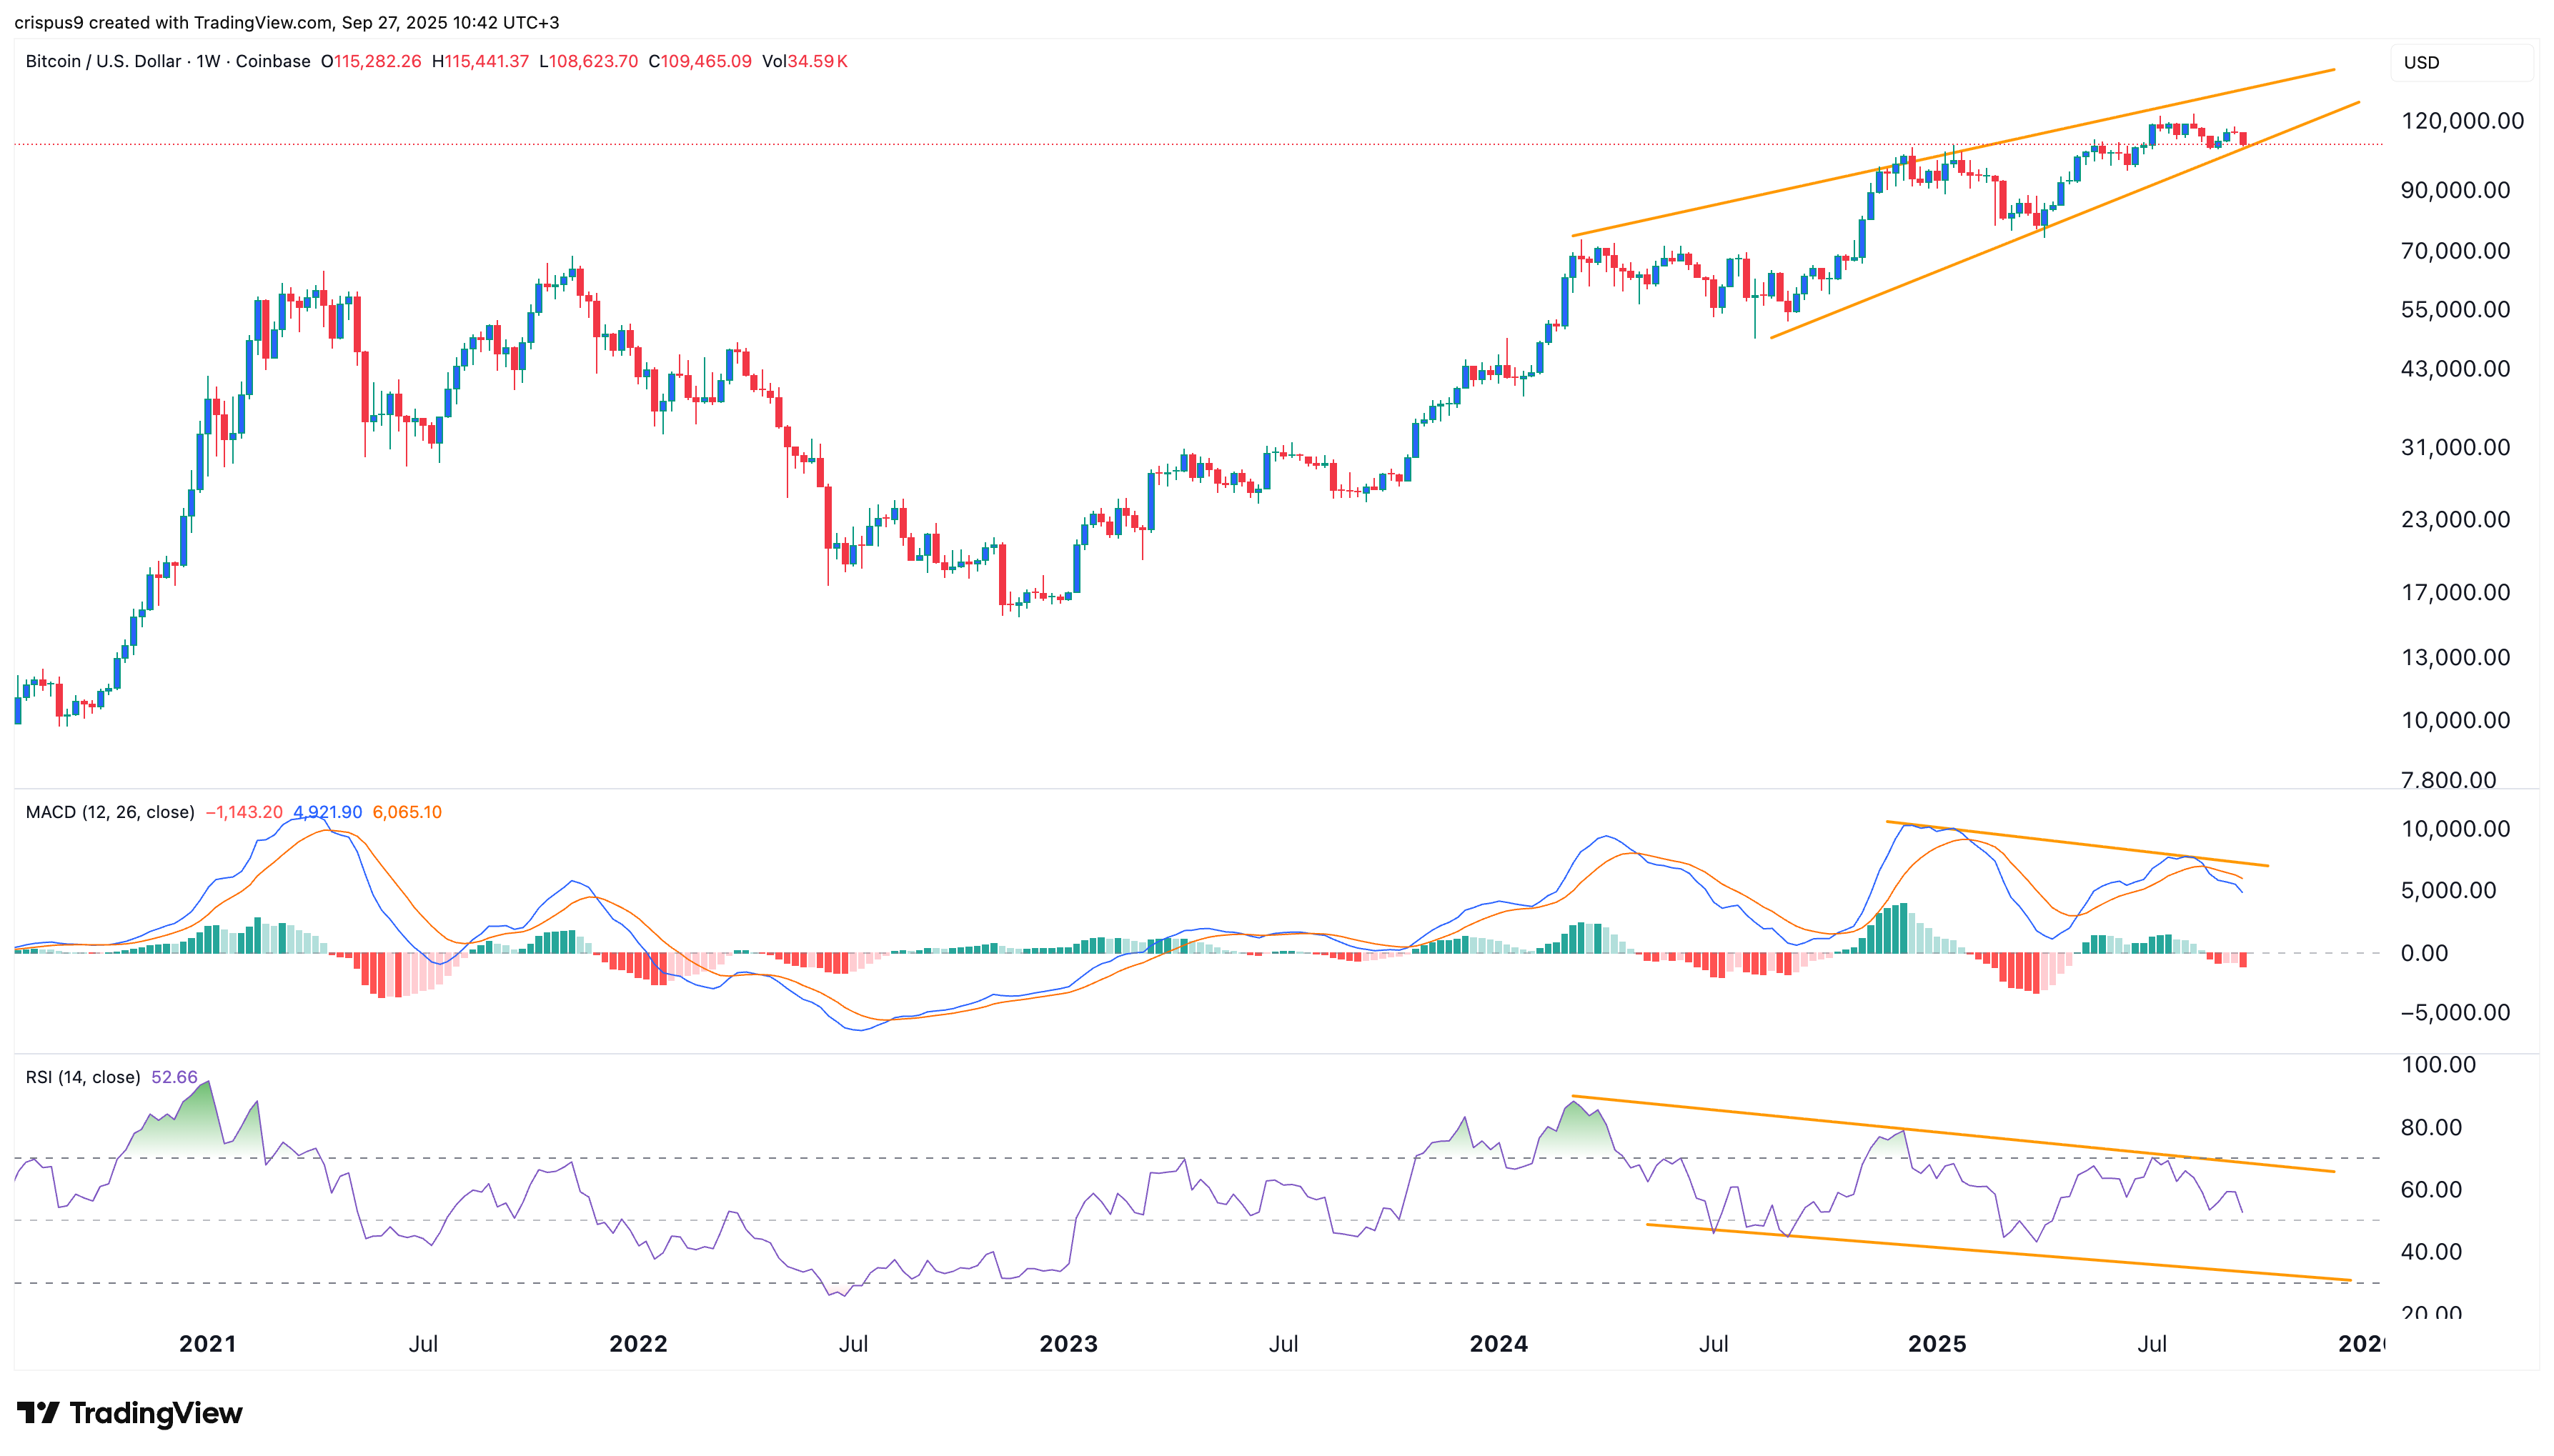
The weekly chart reveals that Bitcoin’s price has created a rising wedge chart pattern, defined by two upward-converging trendlines. These lines are nearing convergence, suggesting a potential bearish breakout.
Concurrently, oscillators such as the Relative Strength Index and MACD have exhibited a bearish divergence pattern, moving downward while the price continued to rise. Both patterns indicate further declines may be on the horizon in the coming weeks.

