Bitcoin has soared to an all-time high, fueled by safe-haven investments, heightened inflows into exchange-traded funds, and a climbing Fear and Greed Index.
Summary
- Bitcoin’s recent surge highlights a revival of investor enthusiasm, spurred by improving market conditions, predictions of Federal Reserve rate reductions, and increasing investments in spot ETFs.
- The combination of favorable macroeconomic factors, seasonal strength, and heightened risk appetite has set BTC up for another possible upswing—indicating a potential new phase of momentum led by institutional investors.
Bitcoin price surges as Crypto Fear and Greed Index escalates
Bitcoin (BTC) prices have continued their robust rally as investors adopt a risk-on approach. This trend is reflected in the rising Crypto Fear and Greed Index, which moved up from the fear zone of 39 in September and is nearing the greed zone of 60.
Typically, Bitcoin and other cryptocurrencies experience gains when the index is trending upward, with acceleration occurring as it approaches the extreme greed zone.
Additionally, BTC price gains are attributed to its perception as a safe-haven asset akin to gold. Evidence of this includes significant inflows into spot BTC ETFs, which have persisted amidst the governmental shutdown.
According to SoSoValue data, these ETFs added over $3.2 billion in assets, raising total inflows to more than $60 billion. BlackRock’s IBIT boasts over $96 billion in assets, ranking it among the top 20 largest ETFs globally.
The record high in Bitcoin prices is also linked to forecasts that the Federal Reserve may lower interest rates this month. It has already decreased rates by 0.25%, positioning the benchmark rate between 4.0% and 4.25%.
The likelihood of further rate cuts grew following weak job reports from ADP and the Bureau of Labor Statistics. The BLS indicated that the number of unemployed Americans surpassed job vacancies.
Moreover, a report from ADP revealed a loss of 36,000 jobs in September following a decline of over 3,000 the previous month. These figures indicate a deteriorating labor market, increasing pressure on the Fed to respond.
Seasonal factors have also influenced the ongoing Bitcoin price rally. Historically, Bitcoin tends to perform well in October and during the fourth quarter.
BTC price technical analysis

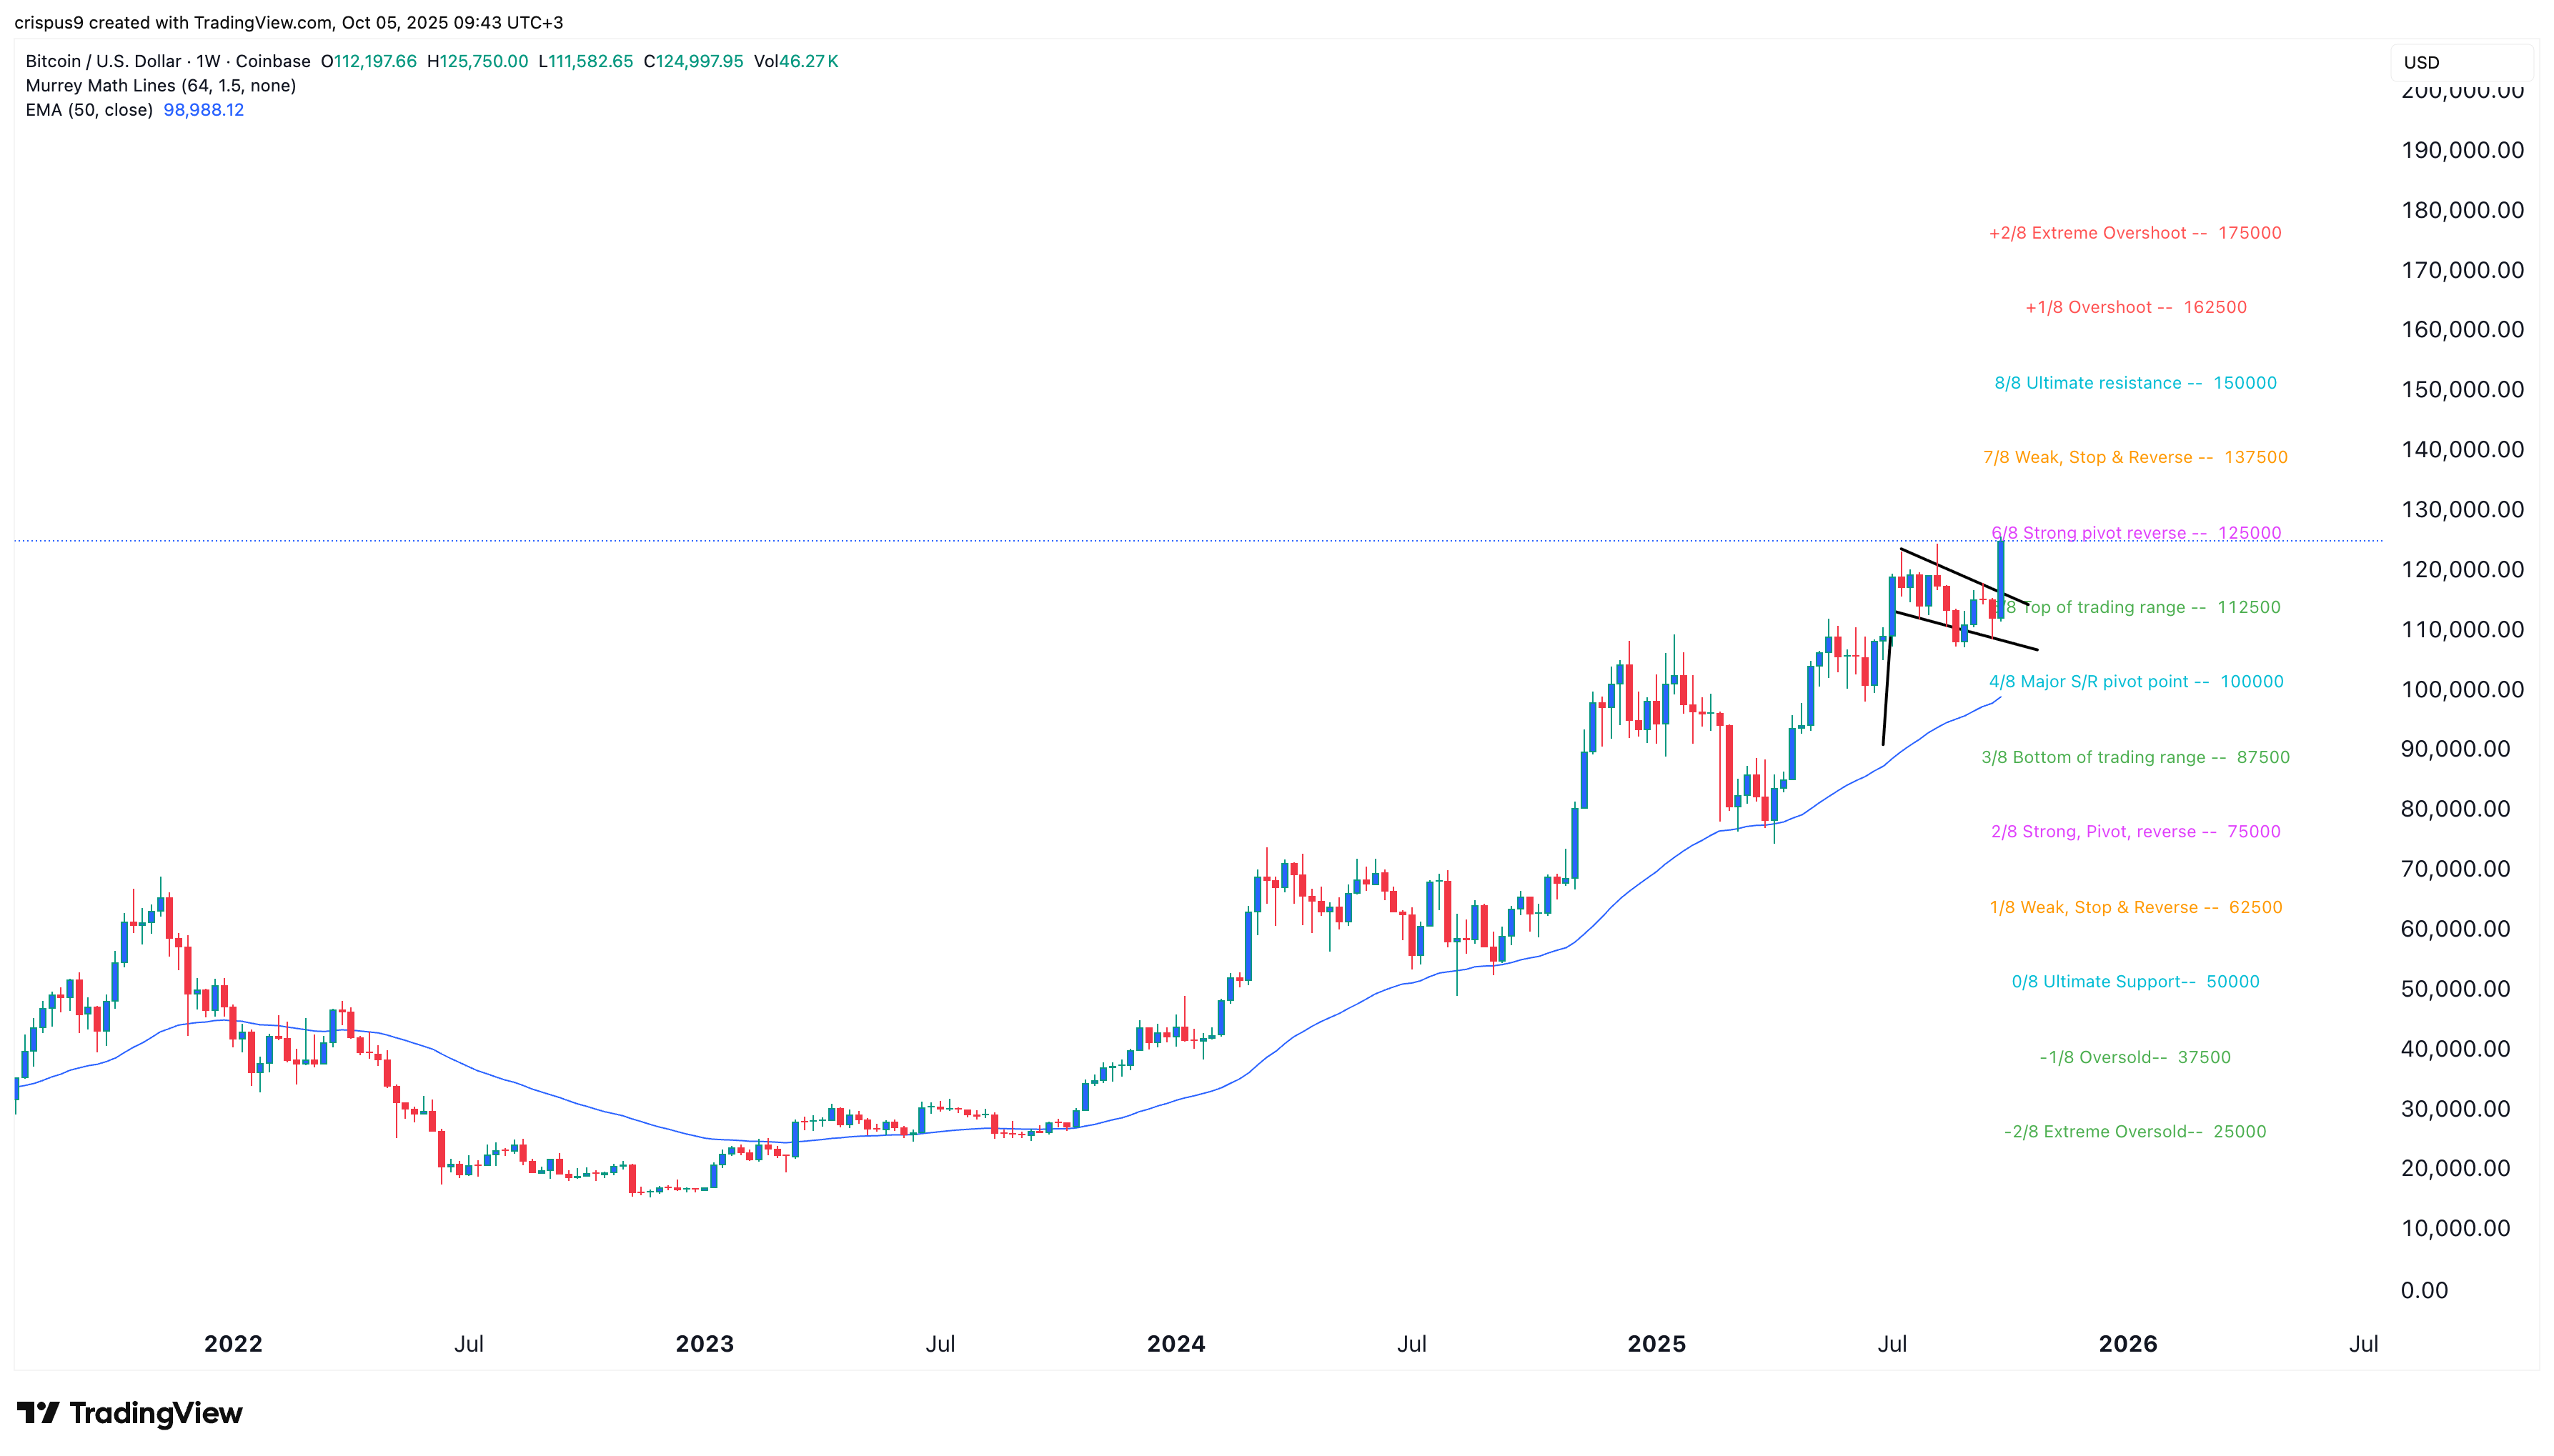
The weekly chart indicates that BTC has been in a vigorous bull run this year, recently rising to a record high of over $125,500 and moving away from the upper boundary of a bullish flag pattern.
Bitcoin has also reached a strong pivot point on the Murrey Math Lines tool and stays above all moving averages.
Consequently, the most probable scenario is continued upward movement as bulls aim for the ultimate resistance at $150,000. A breakthrough of that level may lead to further gains towards an extreme overshoot level at $175,000.

