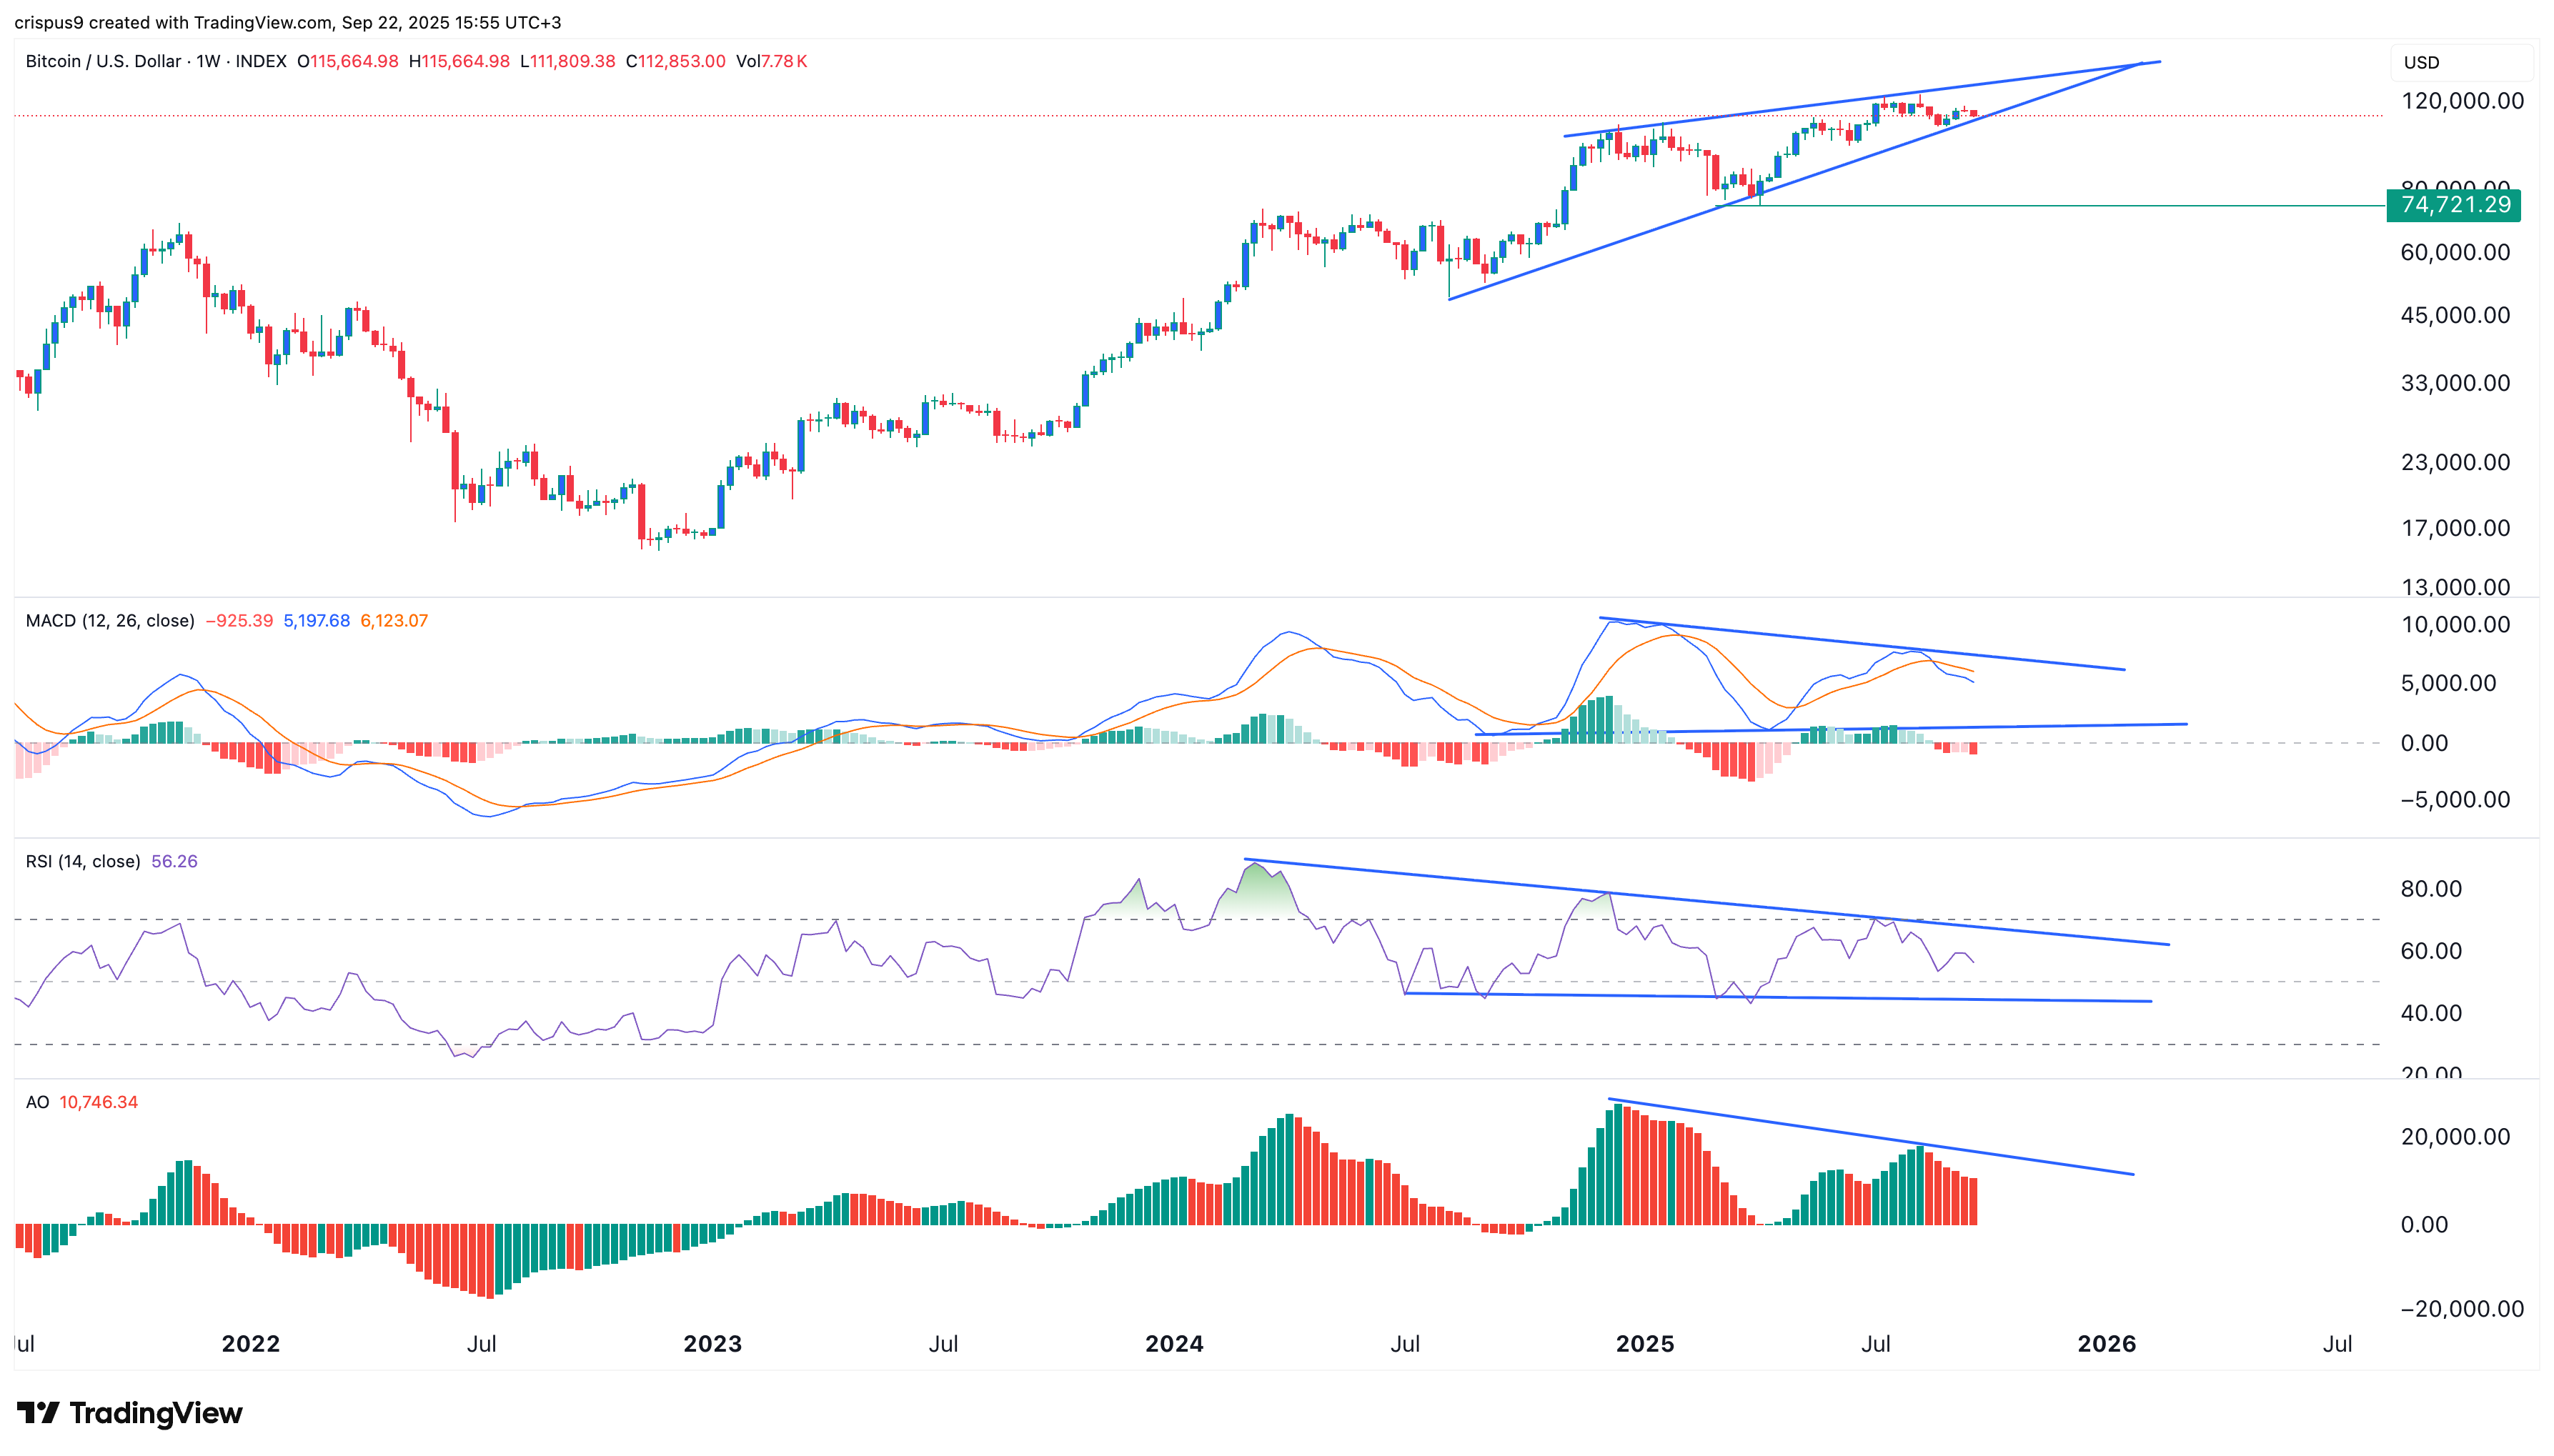
The current cryptocurrency market downturn may intensify soon, as Bitcoin is displaying at least three concerning patterns on its weekly chart.
Summary
- Bitcoin has established a rising wedge pattern on the weekly chart.
- A bearish divergence pattern is also present, indicating a potential crash.
- This crash could trigger a deeper decline across the crypto market.
Bitcoin’s chart shows concerning patterns
The weekly chart for Bitcoin (BTC) reveals several alarming bearish patterns.
To start, a bearish divergence pattern has emerged. The Relative Strength Index (RSI) has created a downward channel since January of the previous year, signaling a bearish divergence.
Furthermore, the MACD indicator has been trending downward since December, with its two lines forming a bearish crossover. Significantly, histogram bars have stayed below the neutral point this month.
The Awesome Oscillator has continued to decline since December. Thus, the RSI, MACD, and AO suggest that Bitcoin has established a bearish divergence pattern, which frequently precedes a substantial bearish breakout.
Moreover, the BTC price has formed a rising wedge pattern since July of last year. The lower trend line connects the lowest points from July of last year, April, and August of this year, while the upper trend line connects the highest points from December, July, and August.
The convergence of these wedge lines indicates a likely strong bearish breakdown ahead. If this occurs, Bitcoin could dip below the psychological threshold of $100,000, targeting support at $74,720, its April low.
A crash in Bitcoin’s price would negatively impact the wider cryptocurrency market, as its performance typically influences other altcoins.

BT price chart | Source: crypto.news
Bullish catalysts in the crypto market
Nonetheless, the crypto market also has some bullish catalysts that could propel it upward in the upcoming months.
First, the Federal Reserve has commenced interest rate cuts, with speculation suggesting that this cutting cycle is just beginning. The dot plot indicates two more reductions this year, while analysts predict further cuts in 2026, especially if Donald Trump succeeds Jerome Powell as Fed chair.
Historical data further suggests that the fourth quarter is typically the most favorable for the crypto market, with average Bitcoin returns around 85% since 2013.
Simultaneously, the Securities and Exchange Commission is anticipated to approve altcoin ETFs in October, with strong investor demand evidenced. The DOJE ETF, boasting an expense ratio of 0.75%, has already amassed $3.9 million in assets, while the XRPR has reached $10.9 million.
Consequently, major Act 33 ETFs are expected to draw more investments due to their low expense ratios and the presence of well-known sponsors like Franklin Templeton and Invesco.

