Ethereum has had a challenging week, declining nearly 6.2% over the last seven days. While many analysts are predicting further corrections, the token has found some stability. In the past 24 hours, the Ethereum price has seen a modest increase of 0.1%, remaining in neutral territory.
Although this slight uptick doesn’t drastically change the situation, a combination of on-chain and chart indicators suggests that something noteworthy may be developing.
Short-Term Holders Step Back In
A sign of renewed vitality is visible in short-term wallets. These addresses usually hold ETH for a brief period before selling. After weeks of reducing their exposure, this group has begun to buy once more.

Data indicates that 1-week to 1-month holders increased their share of ETH supply from 6.9% on July 22 to 9.19% on August 21. Concurrently, 1-day to 1-week holders rose from 1.64% on August 8 to 2.74% on August 21, representing a 67% increase in just two weeks, signaling a return of fresh buying pressure.
HODL Waves illustrate the distribution of coins held across various time frames, helping to identify whether market activities are driven by short-term traders or long-term holders.
Why is this significant? These short-term groups often react first when they spot opportunities. Their renewed engagement suggests confidence that the ETH price may have established a local floor and could be preparing for the next upward movement.
For token TA and market updates: Interested in more token insights like this? Sign up for Editor Harsh Notariya’s Daily Crypto Newsletter here.
SOPR Hints at Market Bottom
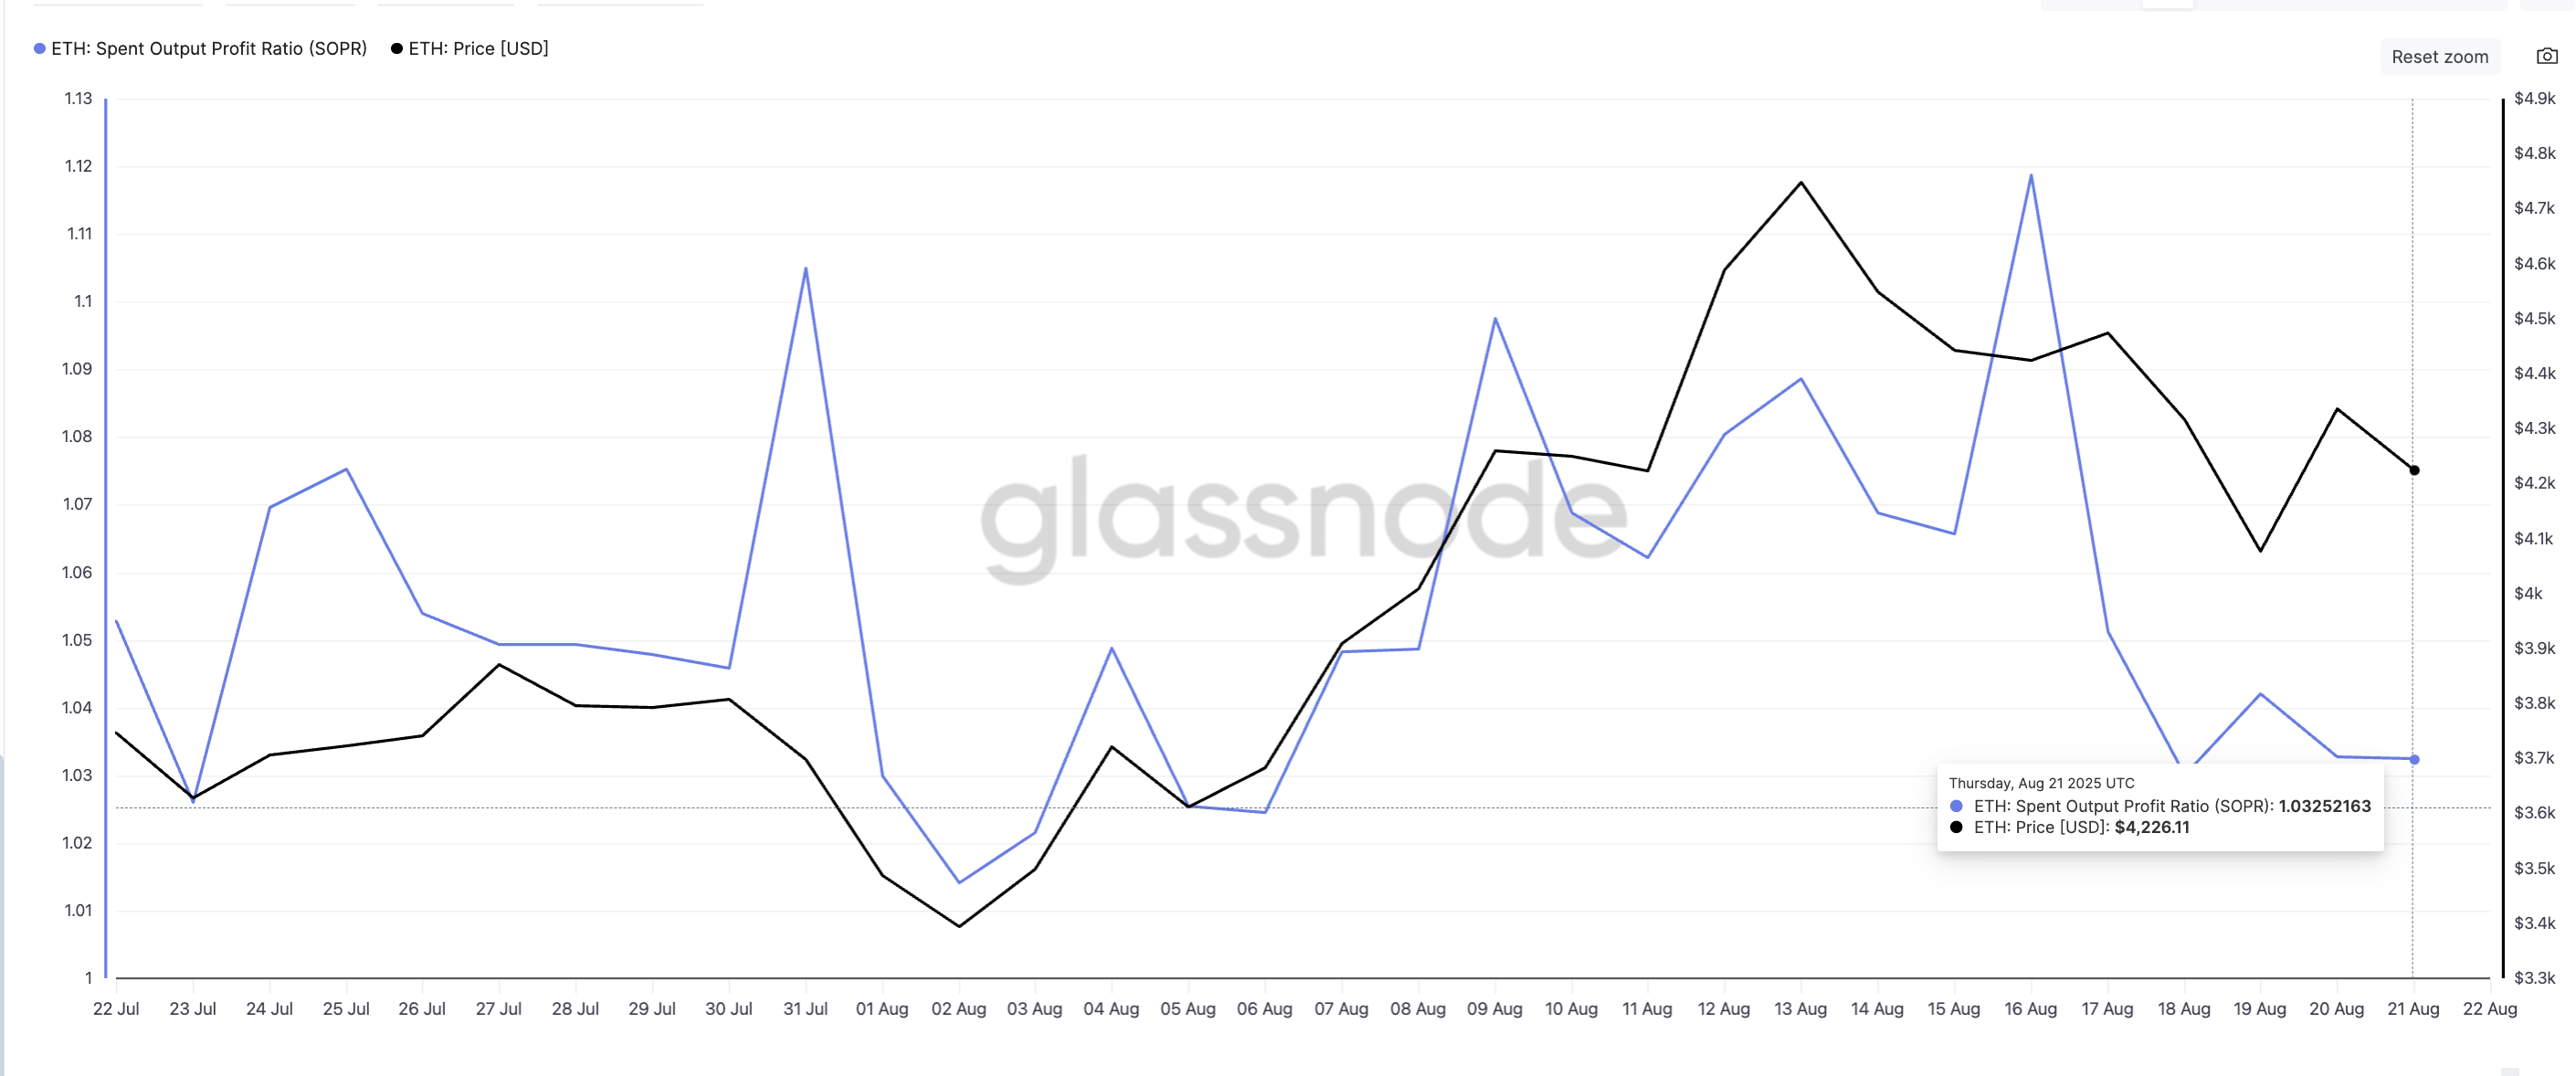
Another aspect to consider is the Spent Output Profit Ratio (SOPR), which measures whether coins moving on-chain are sold at a profit or a loss. A high SOPR indicates holders are cashing out profitably. Conversely, a dip toward 1 or below—especially during price corrections—suggests sellers are taking fewer profits, often near local bottoms.

In the past week, ETH’s SOPR fell from 1.11 to 1.03. A comparable decrease was observed on July 31, when the ratio declined from 1.10 to 1.01. During that time, the drop indicated a market bottom, leading to a bounce from $3,612 to $4,748 in subsequent days—a 31% rally.
A similar scenario may be unfolding now. The SOPR decline signifies a slowdown in profit-taking and a weakening of sellers, which could create conditions for buyers to re-enter the market. If historical patterns hold, this might be an early signal of another Ethereum price rally.
Inverse Head And Shoulders Ethereum Price Pattern in Play
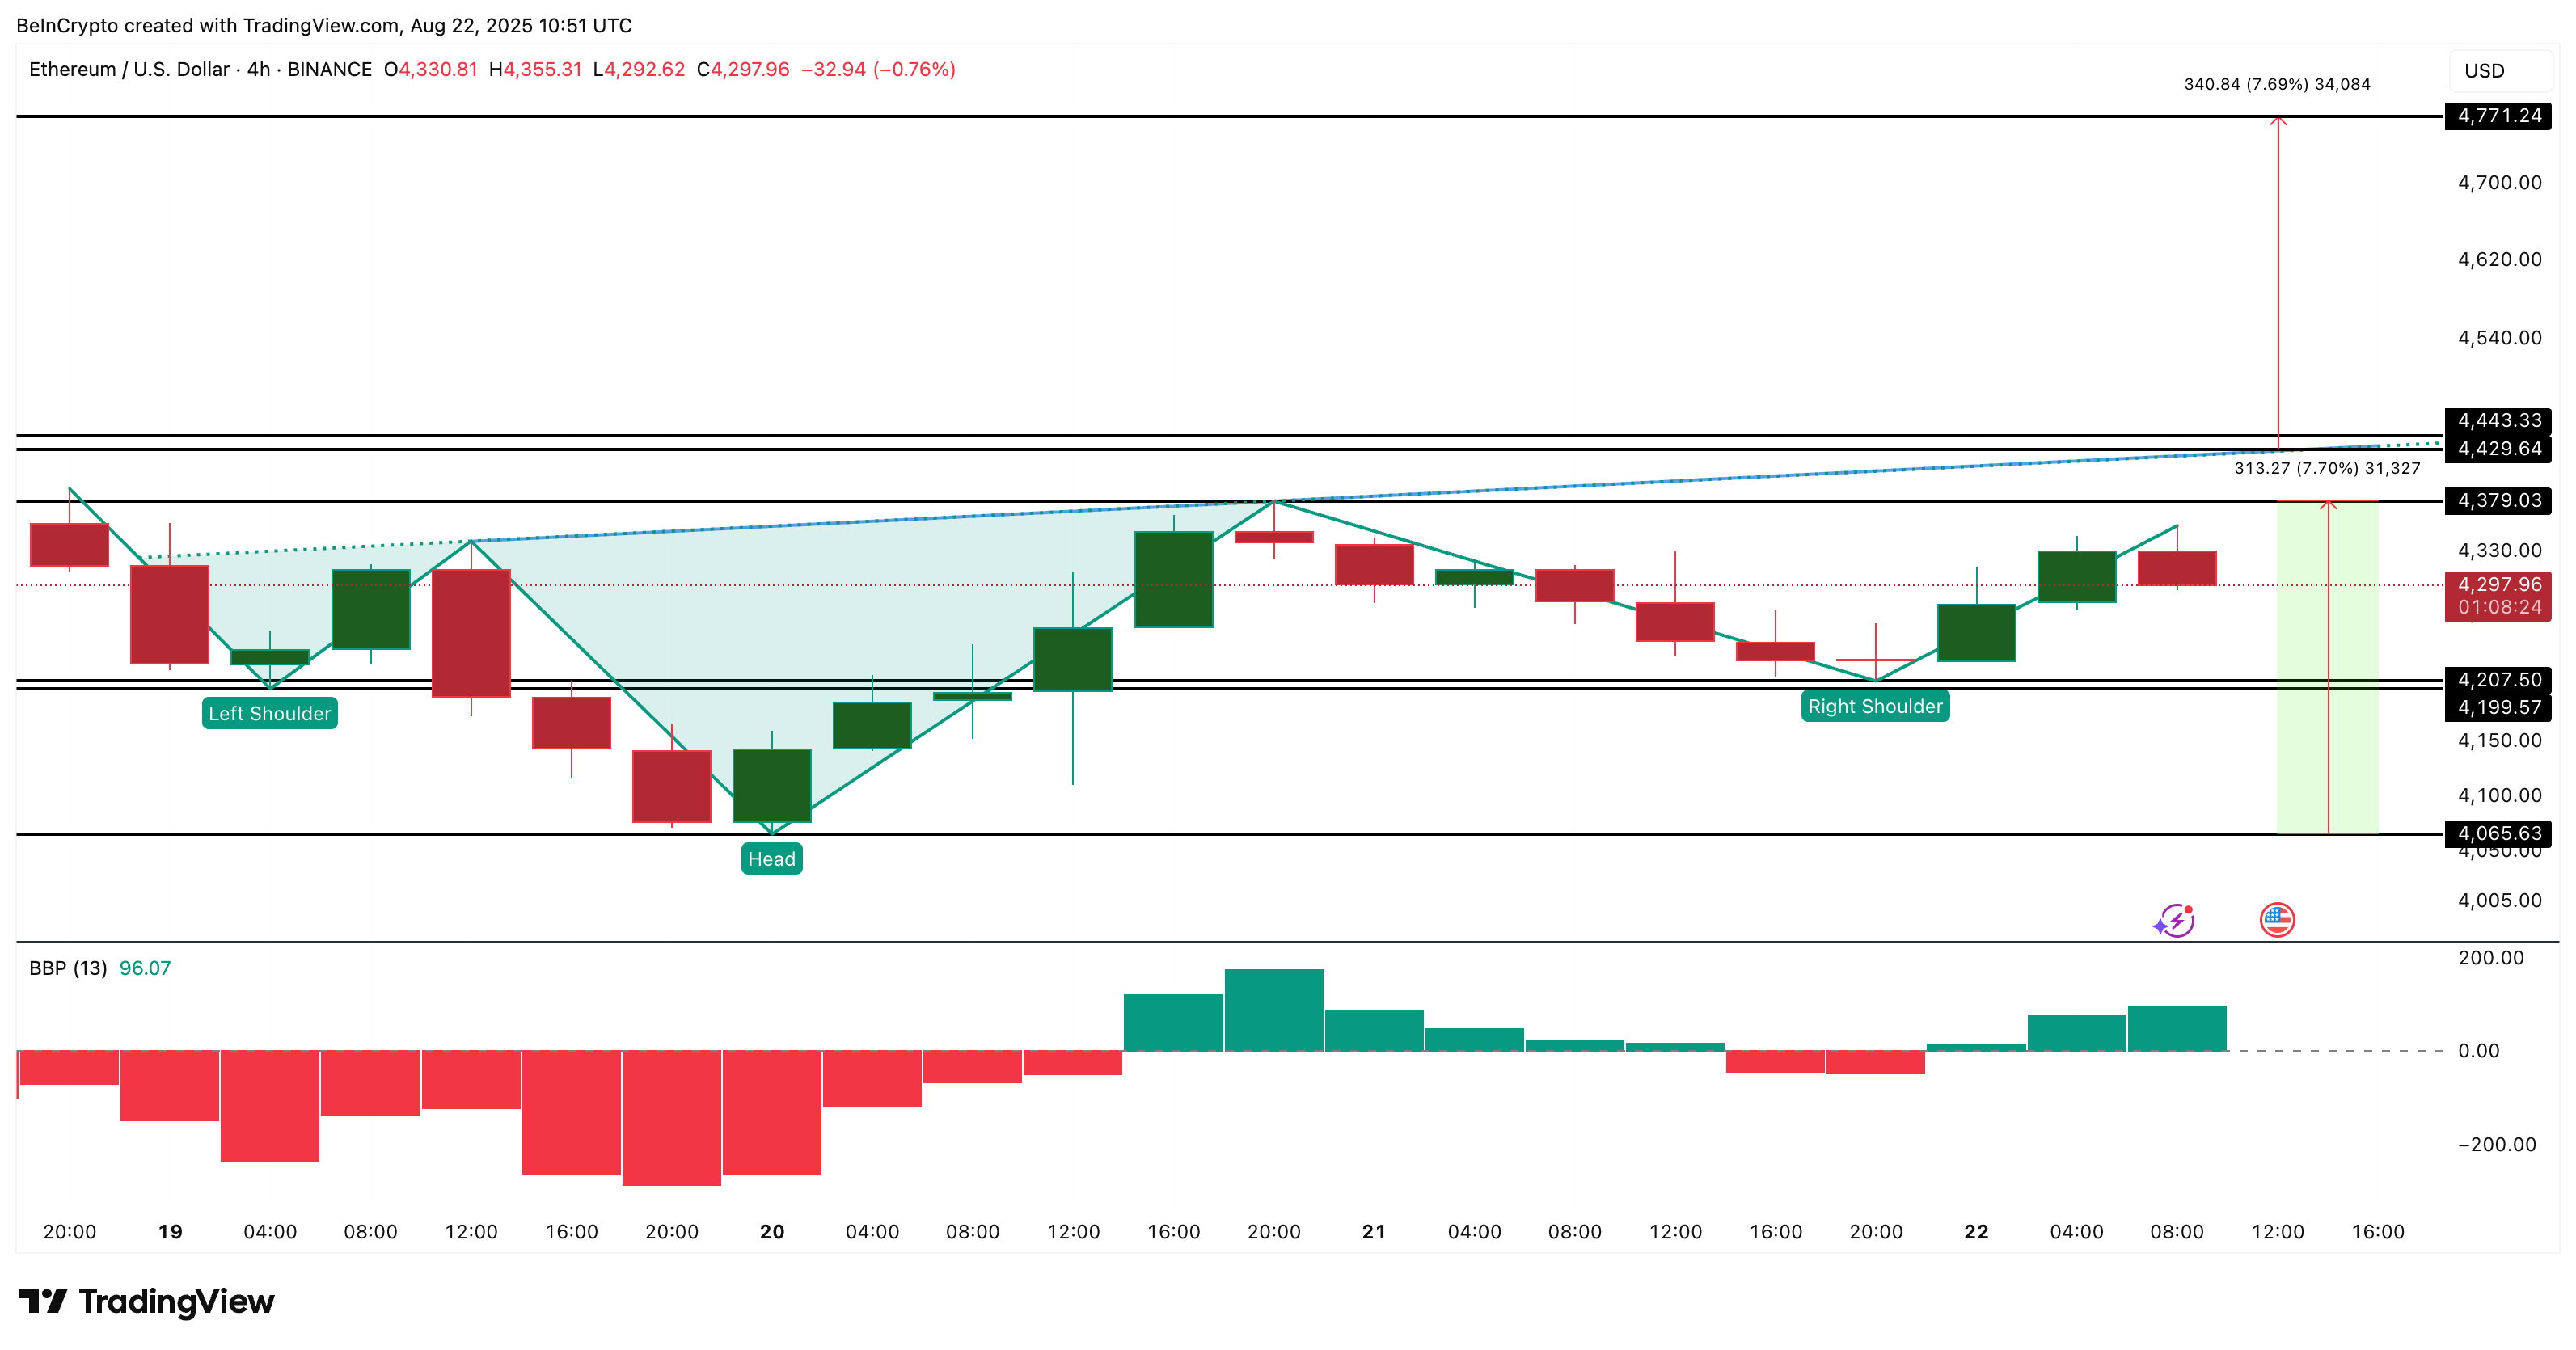
Beyond on-chain indicators, the price chart presents a compelling setup. On the 4-hour chart, ETH is forming an inverse head and shoulders pattern, a classic bullish reversal signal. The neckline of this pattern is situated around $4,379 and has a gentle upward slope, which often bolsters the case for a breakout.

For confirmation, the ETH price must surpass $4,443. If achieved, the technical objective points to $4,770, calculated from the distance between the neckline and the head. This aligns with the broader bullish signs from short-term buyers and the SOPR. Moreover, the rising bullish momentum as the Ethereum price approaches the breakout pattern strengthens the bullish narrative.
The increased bullish momentum is reflected in the rising green bars of the Bull Bear Power indicator, which assesses the gap between the highest price and a moving average to indicate whether buyers or sellers have the upper hand.
Nevertheless, traders should remain cautious of the invalidation level. If ETH falls below $4,207 (the base of the right shoulder), the pattern will be invalidated, and the bullish outlook will be compromised.
The post One Bullish Pattern Could Launch Ethereum (ETH) Price Toward $4,770 appeared first on BeInCrypto.

