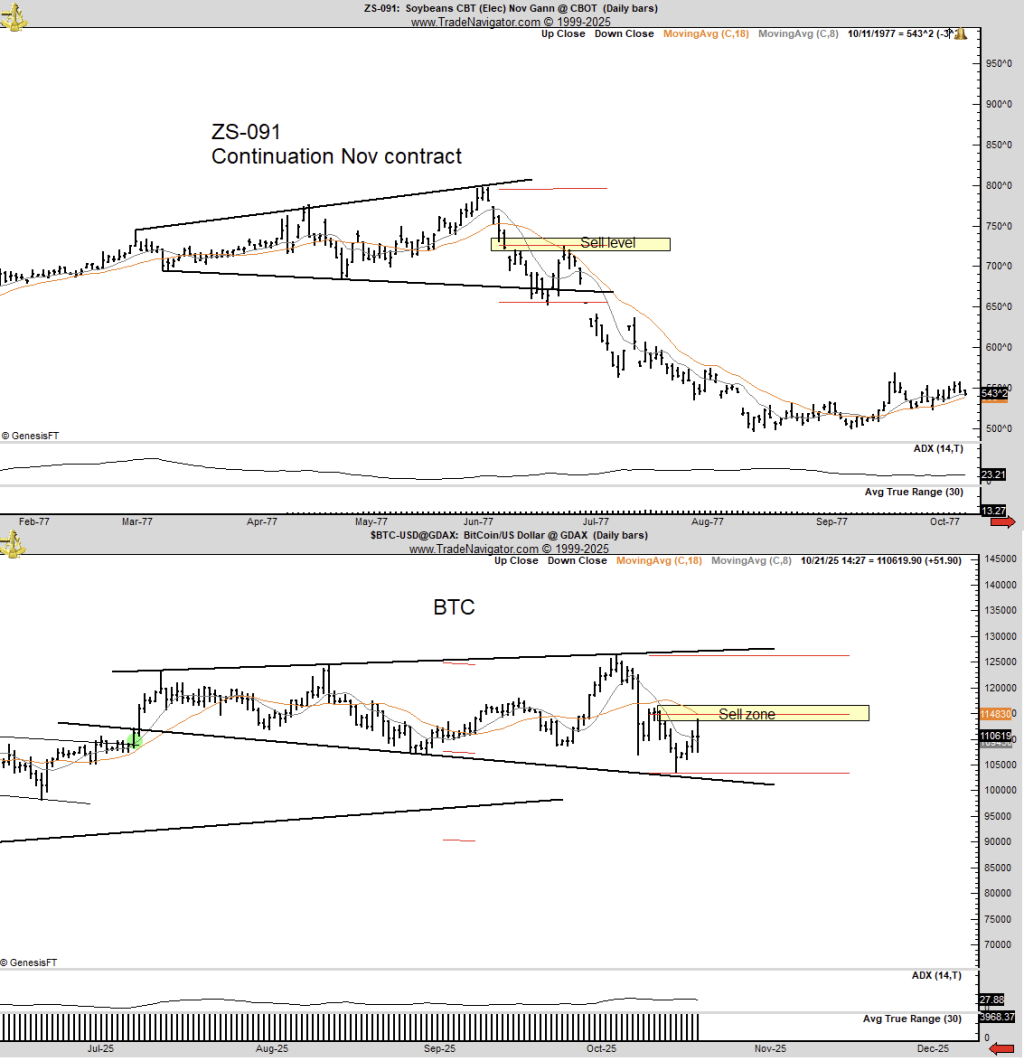
Veteran chartist Peter Brandt kicked off a new technical conversation on X by sharing two annotated charts—one showcasing today’s Bitcoin daily bars and the other from the Chicago Board of Trade soybeans in 1977. He suggests that the cryptocurrency might be forming a broadening top similar to the historical commodity pattern that preceded a 50% decline.
“In 1977, soybeans created a broadening top and subsequently dropped 50% in value,” Brandt stated. “Bitcoin is currently exhibiting a comparable pattern. A 50% decrease in $BTC would leave MSTR underwater. Whether I’m right or wrong, you have to acknowledge that this old guy has the guts to make bold predictions.”

Implications for Bitcoin Price
Brandt’s comparative chart is crucial to his argument. The soybean chart showcases an “Ascending Megaphone” that ultimately resolved lower, while his Bitcoin chart reveals an expanding range defined by rising upper and lower trendlines, with a highlighted “sell zone” around the mid-range at $114,800. The upper boundary is just above $125,000, and the lower trendline is currently tracing a descending band between $102,000 and $100,000.
Related Reading
The BTC chart also includes short-term moving averages (8-period and 18-period) and a moderately elevated ADX reading, depicting a market that has experienced volatility within an expanding corridor rather than maintaining a clear trend. According to Brandt, recent upticks have fallen short of a horizontal resistance band, aligning with the “sell zone” indication.
The post prompted immediate reactions from pattern analysts, particularly Francis Hunt (TheMarketSniper), who contended that the similarity is only surface-level as the direction of the megaphone is significant. “If you apply #HVFmethod, you’d see that while the broadening structures appear alike, the Soybeans formed an Ascending Megaphone during a bullish trend, which is bearish. Bitcoin is currently showing a Descending structure amidst a bullish trend, which could eventually be bullish. Place a splitter between each for net gradient.”
Related Reading
Brandt, known for his extensive history of public predictions across FX, commodities, and crypto, characterized his perspective as a working hypothesis rather than a definitive conclusion. He added a crucial nuance hours later: “I am a Bayesian. I deal with possibilities, not probabilities, and certainly not certainties. At any given moment, I contemplate binary TA and macro narratives — either $250k Bitcoin or $60k Bitcoin. I recognize all opportunities and seek asymmetrical bets in either direction.”
He also acknowledged Hunt’s alternative interpretation: “I’ll be the first to admit that you could be right. I am open to both possibilities. If BTC rises, I’d like to be long; if it falls, I’d prefer to be short.”
At the center of Brandt’s caution is second-order exposure: Strategy (MSTR), the business intelligence firm that has amassed the largest Bitcoin treasury, would be “underwater” if BTC were to halve from current levels. The firm’s average acquisition price stands at approximately $74,010 per BTC (inclusive of fees and expenses), based on the company’s latest disclosure revealing total holdings at 640,418 BTC for a value of roughly $47.4 billion.
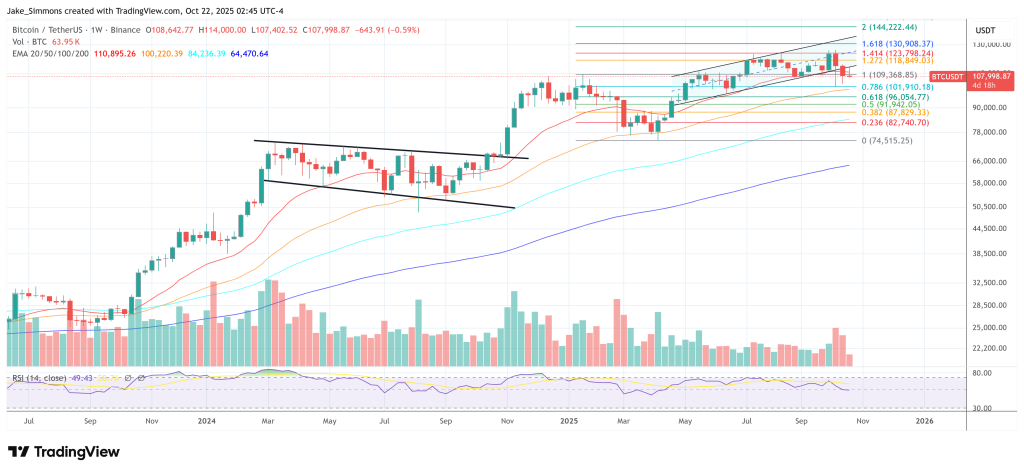
As of this writing, BTC was trading at $107,998.

Featured image created with DALL.E, chart from TradingView.com

