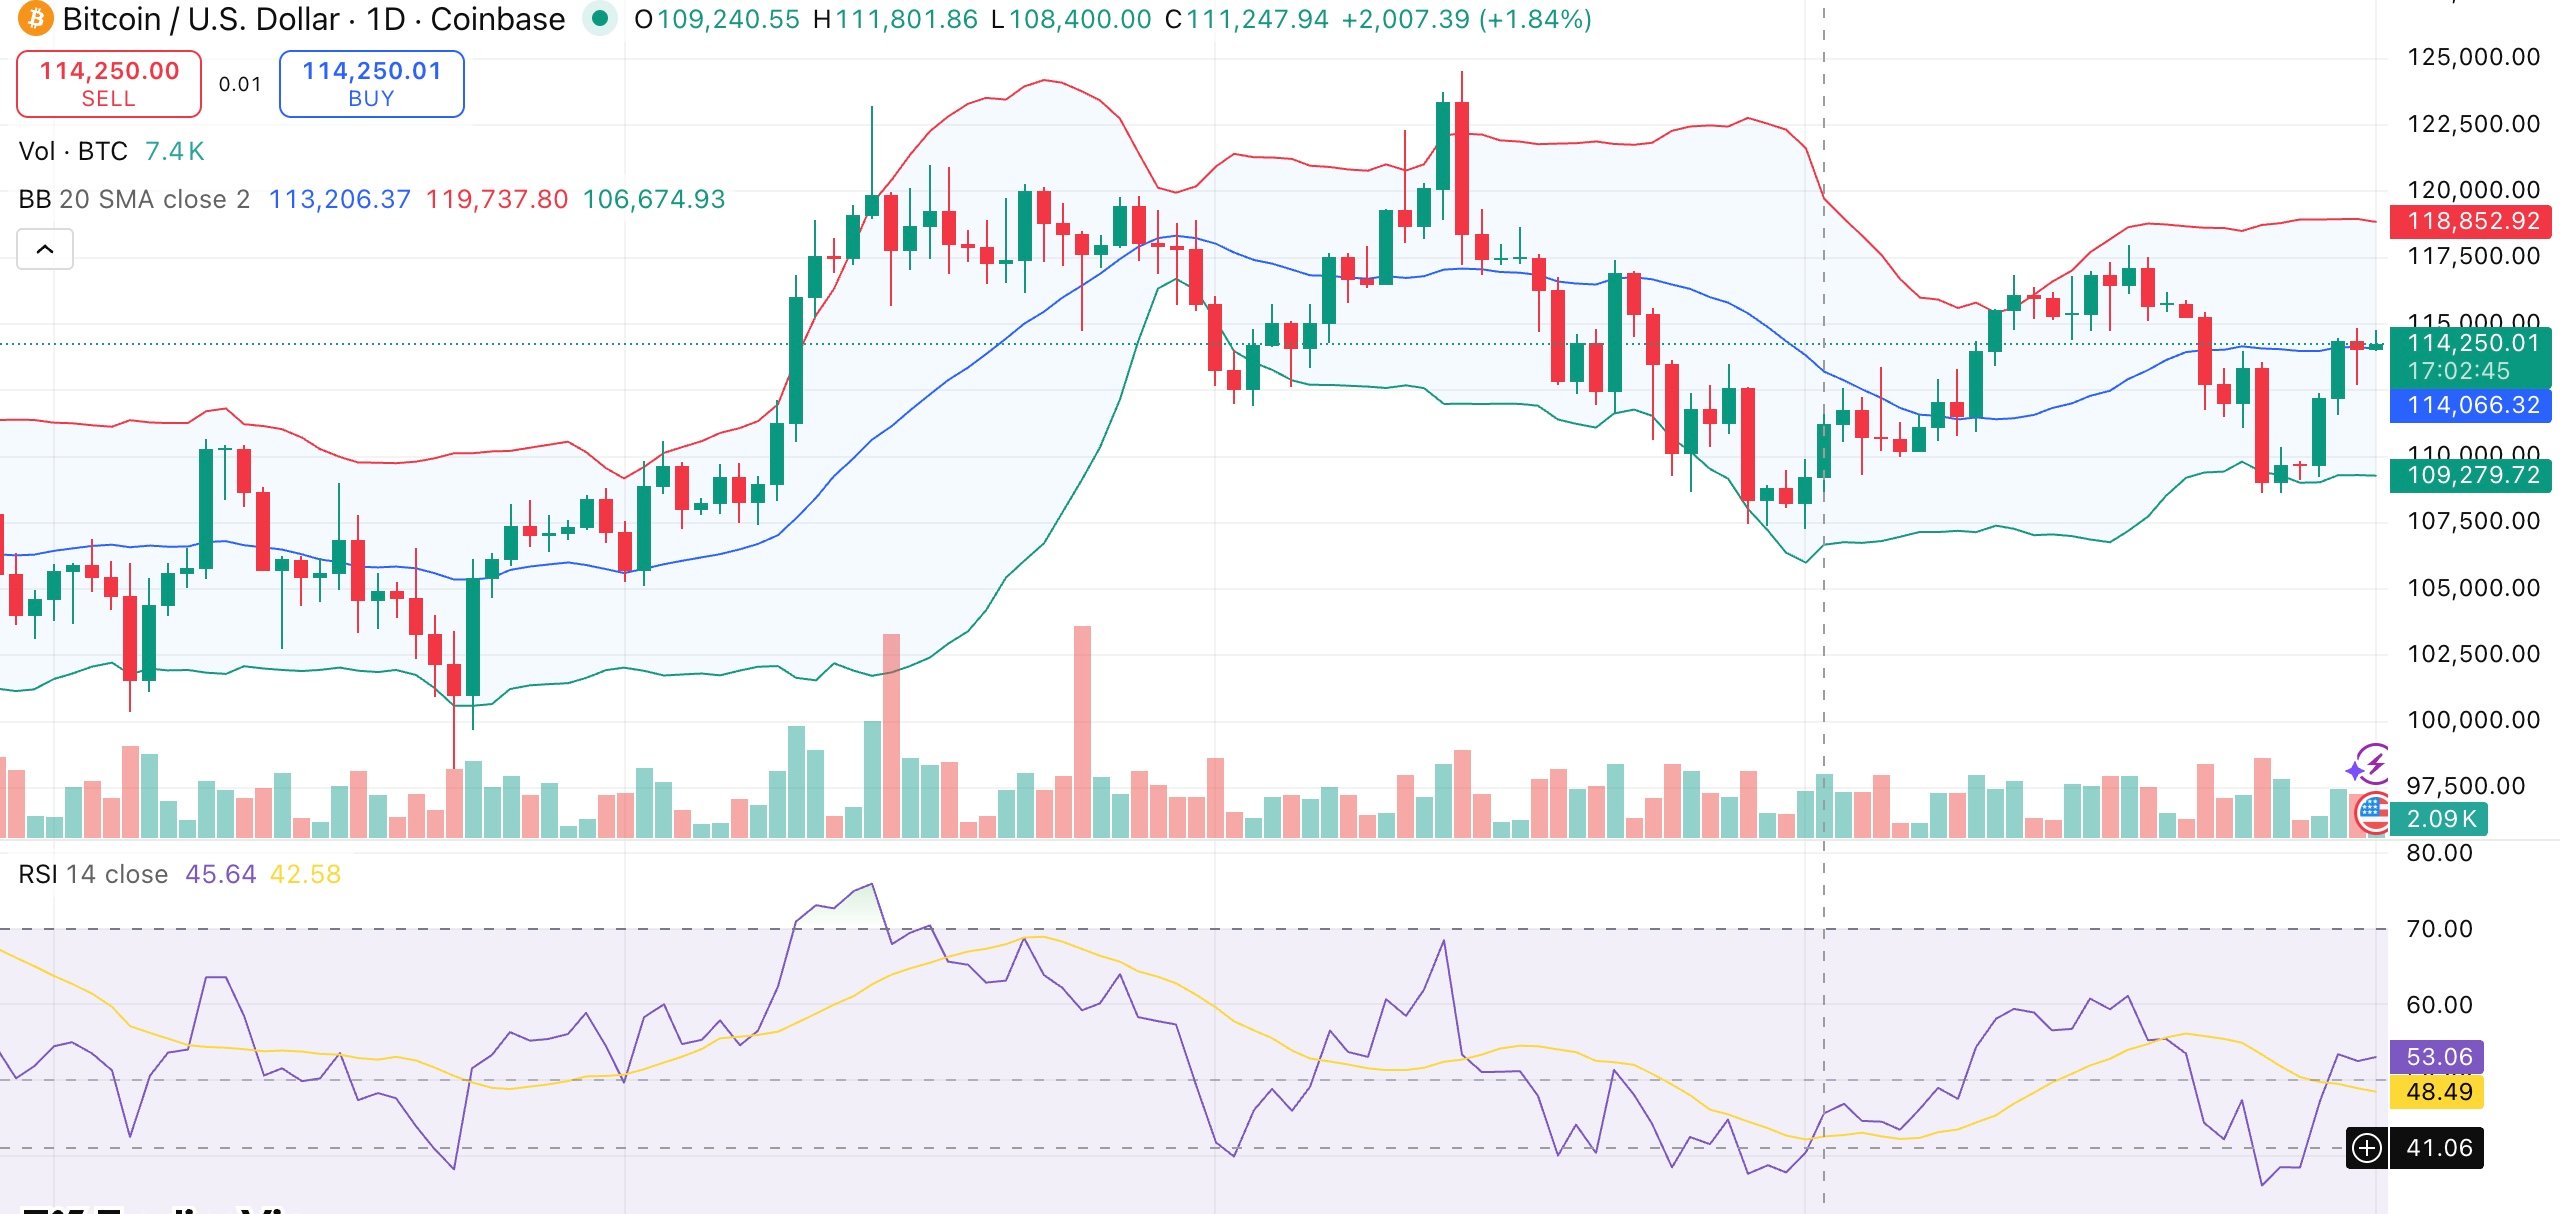
Bitcoin is currently trading above $114,000, bolstered by increasing institutional demand, with spot exchange-traded funds experiencing their highest inflows in several weeks.
Summary
- BTC has risen 6.1% over the past 30 days, approaching the $115K resistance level.
- On September 30, U.S. spot Bitcoin ETFs attracted $429 million in inflows, primarily driven by BlackRock.
- Technical indicators reflect neutral momentum but show solid support, maintaining the bullish outlook.
As of the latest update, BTC is priced at $114,400, up 0.5% within the last 24 hours and 1.5% for the week. Over the past 30 days, the asset has increased by 6.1%, now standing 7.9% below its all-time high of $124,128 achieved on August 14.
Daily trading activity was recorded at $56.3 billion, a decline of 6.1% compared to the previous session, suggesting reduced activity in spot markets. In the derivatives space, Coinglass data reflects mixed market conditions.
Volume for Bitcoin (BTC) futures grew by 2% to $80.95 billion, while open interest decreased slightly by 0.5% to $81.79 billion, indicating that traders are engaged but are maintaining cautious leverage.
Strengthened “Uptober” Outlook for BTC Spot ETF Inflows
ETF inflows are fostering optimism as October kicks off. Data from SoSoValue indicates that U.S. spot Bitcoin ETFs recorded $429.9 million in net inflows on September 30, marking two consecutive days of growth.
Leading the inflows, BlackRock’s IBIT brought in $199.4 million, followed by Ark Invest’s ARKB at $105.7 million and Fidelity’s FBTC at $54.7 million. No ETF noted outflows, boosting the total monthly inflows to $3.53 billion. Analysts believe this trend could persist into Q4.
In the past year, Bitcoin’s market capitalization has risen from $870 billion to $1.07 trillion, averaging daily inflows of $385 million, according to Carmelo Alemán, a contributor to CryptoQuant. Accumulation by large wallets and cautious selling by miners indicate a fundamentally bullish market, while record-high global liquidity may further support BTC’s ascent.
Alemán posits that these factors pave the way for a new all-time high, with an ambitious target of $180,000 set for Q4.
Technical Analysis of Bitcoin Price
Bitcoin is currently consolidating just below the $115,000 resistance level. Bollinger Bands suggest that volatility is expected to rise as the price approaches the upper band. The stochastic reading of 61 indicates that the market is not yet overheated, while the relative strength index stands at 54, reflecting neutral momentum.

The bullish outlook is reinforced by the majority of moving averages. The 200-day simple moving average at $104,920 provides a robust support level, and both short- and long-term averages remain in buy territory. A decisive breakout above $115,000 could potentially lead to a test of August’s high, close to $124,000. Immediate support is noted around $113,000.
In a bullish scenario, sustained institutional accumulation and ETF demand could propel Bitcoin to new heights. However, if conditions shift negatively, a retracement to $110,000 may occur.

