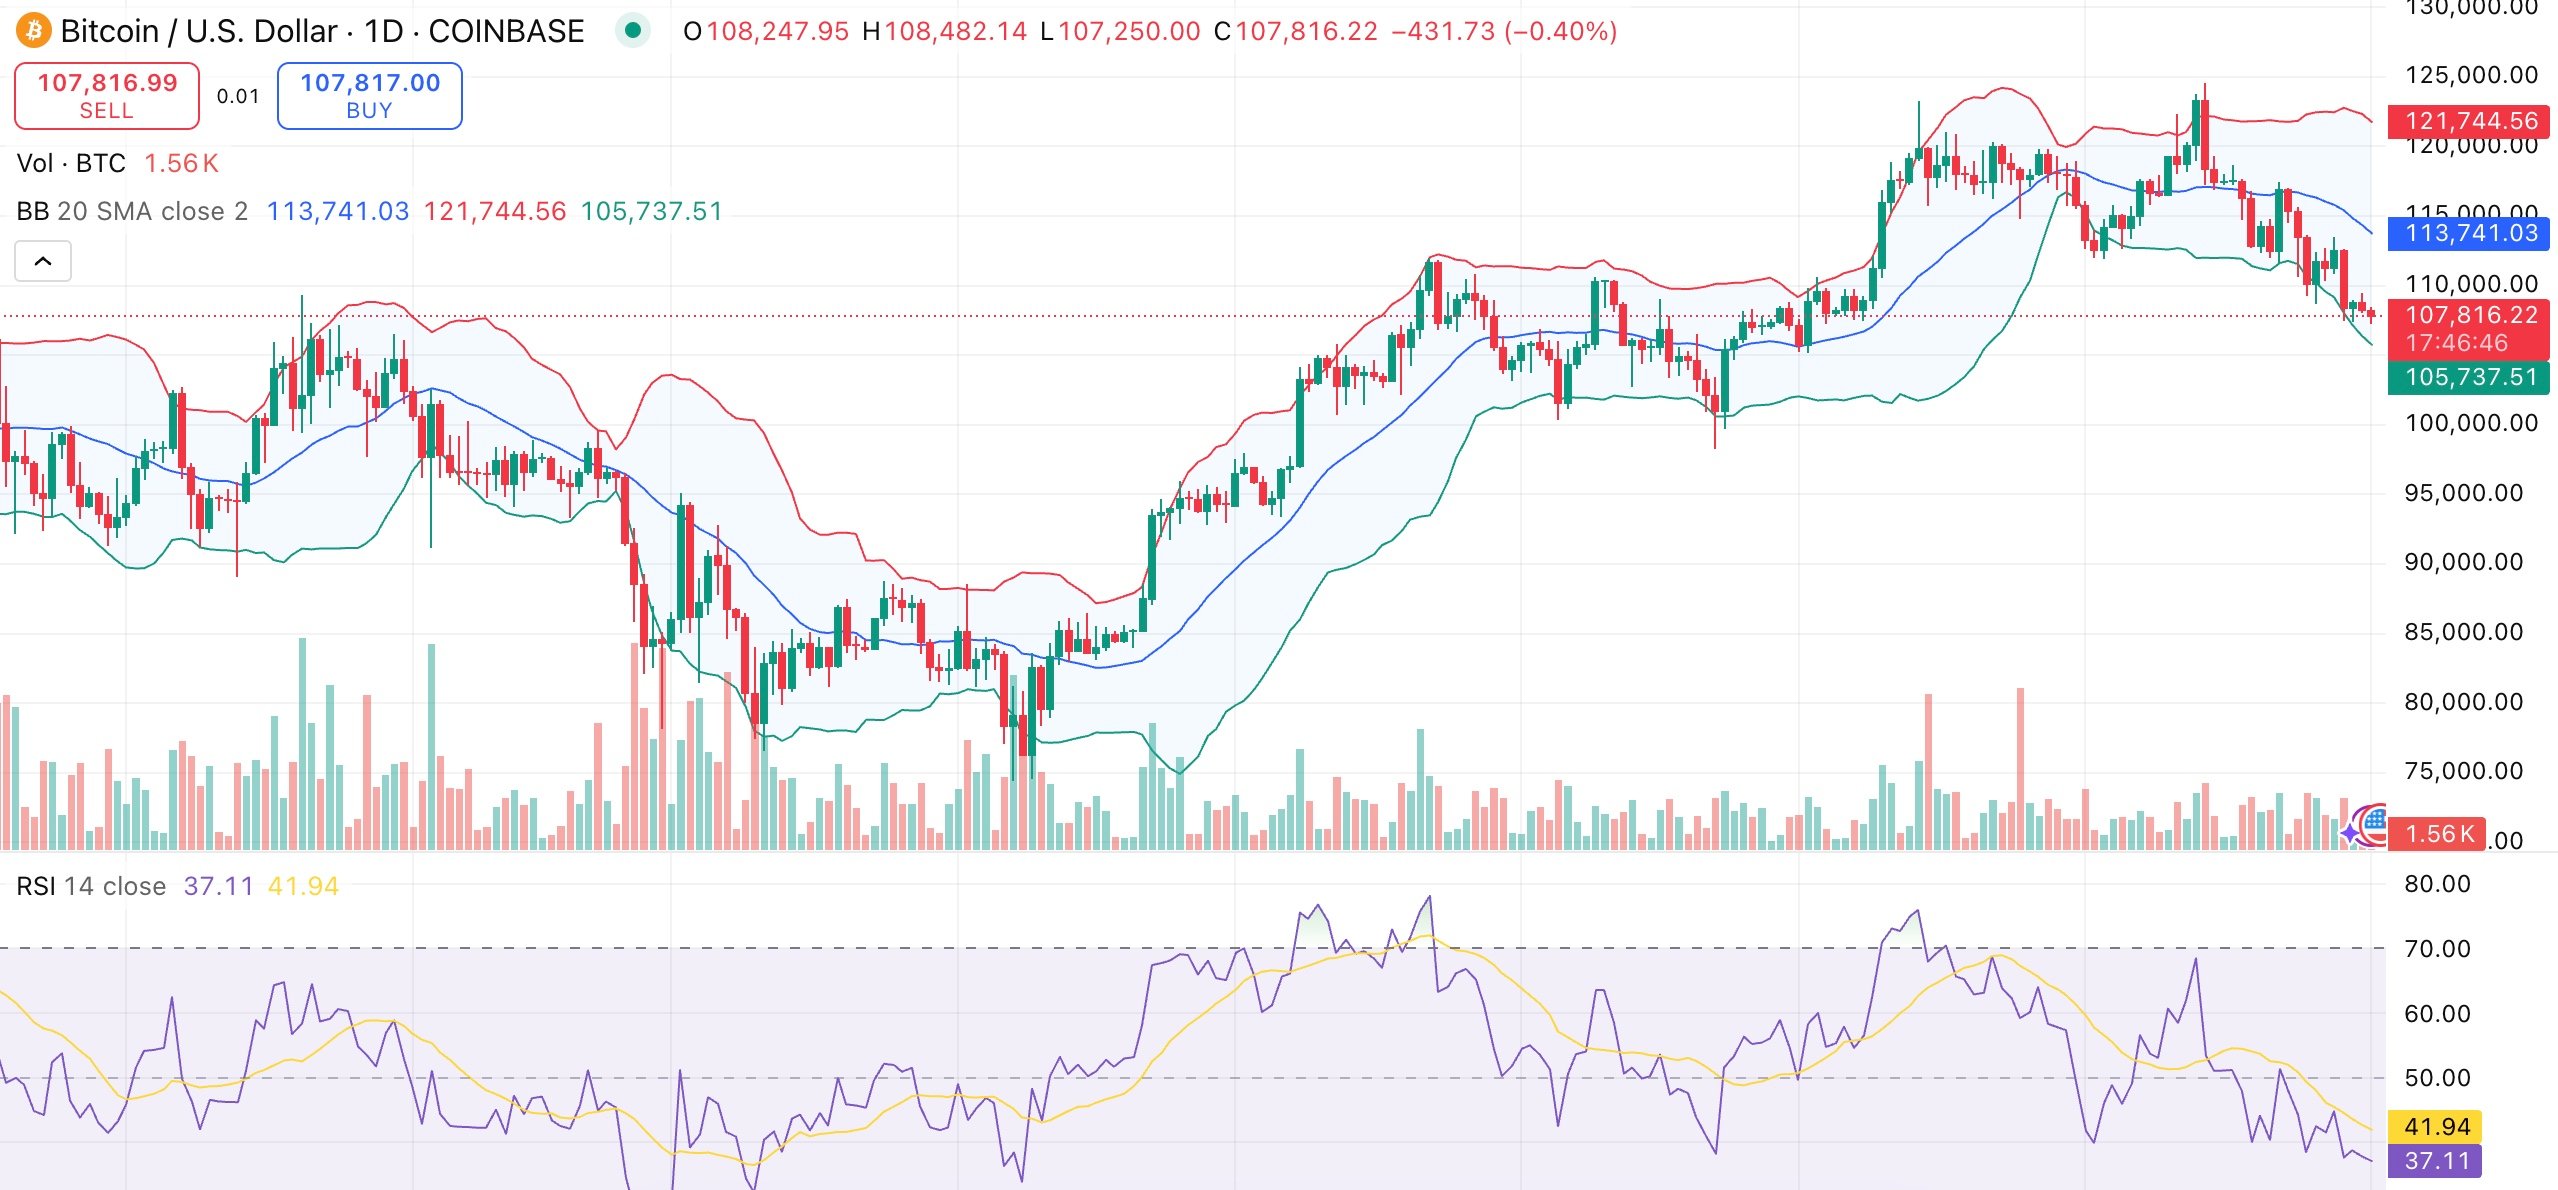
The price of Bitcoin has dipped below $108,000; however, both on-chain and trading metrics indicate that the market remains stable, with institutional interest and technical indicators suggesting a robust setup.
Summary
- Bitcoin is currently priced at $107,820, reflecting a 13% decrease from its all-time high in August.
- Spot and derivatives trading volumes have surged, indicating increased market activity.
- On-chain metrics and technical analysis reveal significant structural support.
As of Monday, Bitcoin (BTC) has dropped to $107,820, representing a 1% decline over the last 24 hours. In the past week, its trading range has fluctuated between $107,414 and $113,220, resulting in a 4% dip over seven days and a 5.4% decrease over the past month. Compared to its peak of $124,128 on August 14, Bitcoin is now down by 13%.
Despite this price drop, market activity has risen. Spot trading volume saw a 30% increase in the last day, reaching $30.6 billion, while derivatives data from Coinglass reported a significant uptick in participation.
Futures trading volume increased by 44.55%, reaching $58.42 billion, and open interest has also risen to $80.41 billion. This trend indicates that new positions are being established rather than existing ones being closed, reflecting greater confidence among active traders.
Strong on-chain signals indicate support
A recent analysis by CryptoQuant’s XWIN Research Japan on September 1 highlighted that two key structural indicators, Delta Cap and the Coinbase Premium Gap, continue to underscore Bitcoin’s foundational strength.
Delta Cap, currently at $739.4 billion with an implied price of $108,900, is calculated based on the gap between Realized Cap and Average Cap. Historically, this metric has acted as a cycle floor, helping to pinpoint times of consistent capital inflow that support Bitcoin’s value.
The fact that Bitcoin’s current spot price exceeds Delta Cap comfortably indicates investor confidence persists, even amid short-term corrections.
The Coinbase Premium Gap, which measures the price difference between Coinbase and Binance, stands at +11.6. A positive premium suggests heightened demand from U.S. institutions willing to pay a premium for Bitcoin. In past cycles, enduring premiums often preceded price increases, hinting at new institutional accumulation.
Technical analysis of Bitcoin’s price
The Bitcoin market is consolidating just above a crucial psychological support level at $107,000. On the daily chart, Bitcoin is trading near the lower band of its Bollinger range, indicating possible short-term oversold conditions.

The relative strength index is nearing a neutral position but is slightly tilted downward, so an increase in buying momentum could trigger a rebound. The MACD signals are leveling off, which often precedes a potential reversal, yet they remain mildly bearish.
A sustained move above $110,000 could pave the way to $113,000 and further tests around $118,000, but a break below $107,000 raises the chances of a decline toward $104,000.

