Close Menu
maincoin.money
    What's Hot

    Spot Bitcoin ETFs experience $1.23 billion in weekly withdrawals, with supply dropping to a six-year low.

    October 20, 2025

    BTC Entering ‘Reaccumulation Stage’ Amid Fed Easing Expectations and Changes in Trump Tariffs: Crypto Daybook Americas

    October 20, 2025

    Dorsey’s Tweet on ‘Bitcoin vs. Crypto’ Ignites Community Discussion

    October 20, 2025
    Facebook X (Twitter) Instagram
    maincoin.money
    • Home
    • Altcoins
    • Markets
    • Bitcoin
    • Blockchain
    • DeFi
    • Ethereum
    • NFTs
      • Regulation
    Facebook X (Twitter) Instagram
    maincoin.money
    Home»Markets»Anticipated Ethereum Price Trends for September 2025
    Markets

    Anticipated Ethereum Price Trends for September 2025

    Ethan CarterBy Ethan CarterAugust 31, 2025No Comments4 Mins Read
    Facebook Twitter Pinterest LinkedIn Tumblr Email
    Anticipated Ethereum Price Trends for September 2025
    Share
    Facebook Twitter LinkedIn Pinterest Email

    Ethereum (ETH) appears to be closing August on a high note, with an increase of over 23% and ending a three-year trend of negative Augusts. In contrast to Bitcoin, which has had a tough month, ETH has demonstrated resilience.

    However, historically, September has been one of Ethereum’s weaker months, with modest gains of 3.20% in 2024 and 1.49% in 2023 following a series of losses in previous Septembers. With the charts showing mixed signals, ETH may be in for a turbulent month.


    Long-Term Holders May Take Profits

    A crucial metric to monitor is Ethereum’s Net Unrealized Profit/Loss (NUPL), which gauges the overall profitability of holders.

    A high NUPL indicates that most wallets are in profit, often signaling that some may take profits. Currently, Ethereum’s long-term holder NUPL is at 0.62, nearing a three-month peak.

    Ethereum Holders Might Book Profits
    Ethereum Holders Might Book Profits: Glassnode

    Historically, similar levels have precipitated corrections. On August 17, when NUPL reached 0.63, ETH dropped from $4,475 to $4,077 (-8.9%). Later that month, it fell from $4,829 to $4,380 (-9.3%) at 0.66. This suggests that September might bring volatility or range-bound action.

    Ethereum Price's Historical Performance
    Ethereum Price’s Historical Performance: CryptoRank

    Historically, September hasn’t been ETH’s best month. This history, coupled with a high NUPL, supports the argument for potential volatility.

    For token TA and market updates: Want more insights like this? Sign up for Editor Harsh Notariya’s Daily Crypto Newsletter here.

    Nevertheless, long-term fundamentals remain supportive of a price increase. In an exclusive interview with BeInCrypto, Kevin Rusher, CEO of RAAC, explained:

    “In September, I expect the factors influencing Ethereum’s price to remain largely unchanged, mainly the increasing trend of companies buying ETH for their treasuries. Just this week, Standard Chartered cited this as the key reason for raising its ETH price target to $7,500,” he mentioned.

    This accumulation trend, along with Ethereum’s function in DeFi and real-world asset (RWA) tokenization, might help mitigate downside risks even if short-term volatility persists.


    Cost Basis Heatmap Indicates Key Resistance

    Another essential metric is the Cost Basis Heatmap, illustrating where ETH was last accumulated. These areas often serve as natural support or resistance.

    Key ETH Accumulation Clusters
    Key ETH Accumulation Clusters: Glassnode

    The strongest support level is between $4,323 and $4,375, where over 962,000 ETH were accumulated. Below that, additional support exists at $4,271–$4,323 (418,872 ETH) and $4,219–$4,271 (329,451 ETH), offering buffers in case of a price decline.

    The major challenge lies above. Between $4,482 and $4,592, nearly 1.9 million ETH were accumulated, creating a significant resistance zone.

    If the ETH price surpasses this, momentum could shift toward $4,956. More details on this later when discussing Ethereum’s price action.


    Technical Charts Indicate Ethereum Price Fluctuations

    The 2-day Ethereum price chart reveals that it has fallen below an ascending trendline. This does not confirm a bearish reversal but indicates a fading bullish momentum.

    The Relative Strength Index (RSI), which assesses the speed and strength of price movements, has created a bearish divergence—showing price making higher highs while the RSI trends lower.

    This typically indicates weakening strength and a probability of range-bound trading, particularly if it occurs on a longer timeframe.
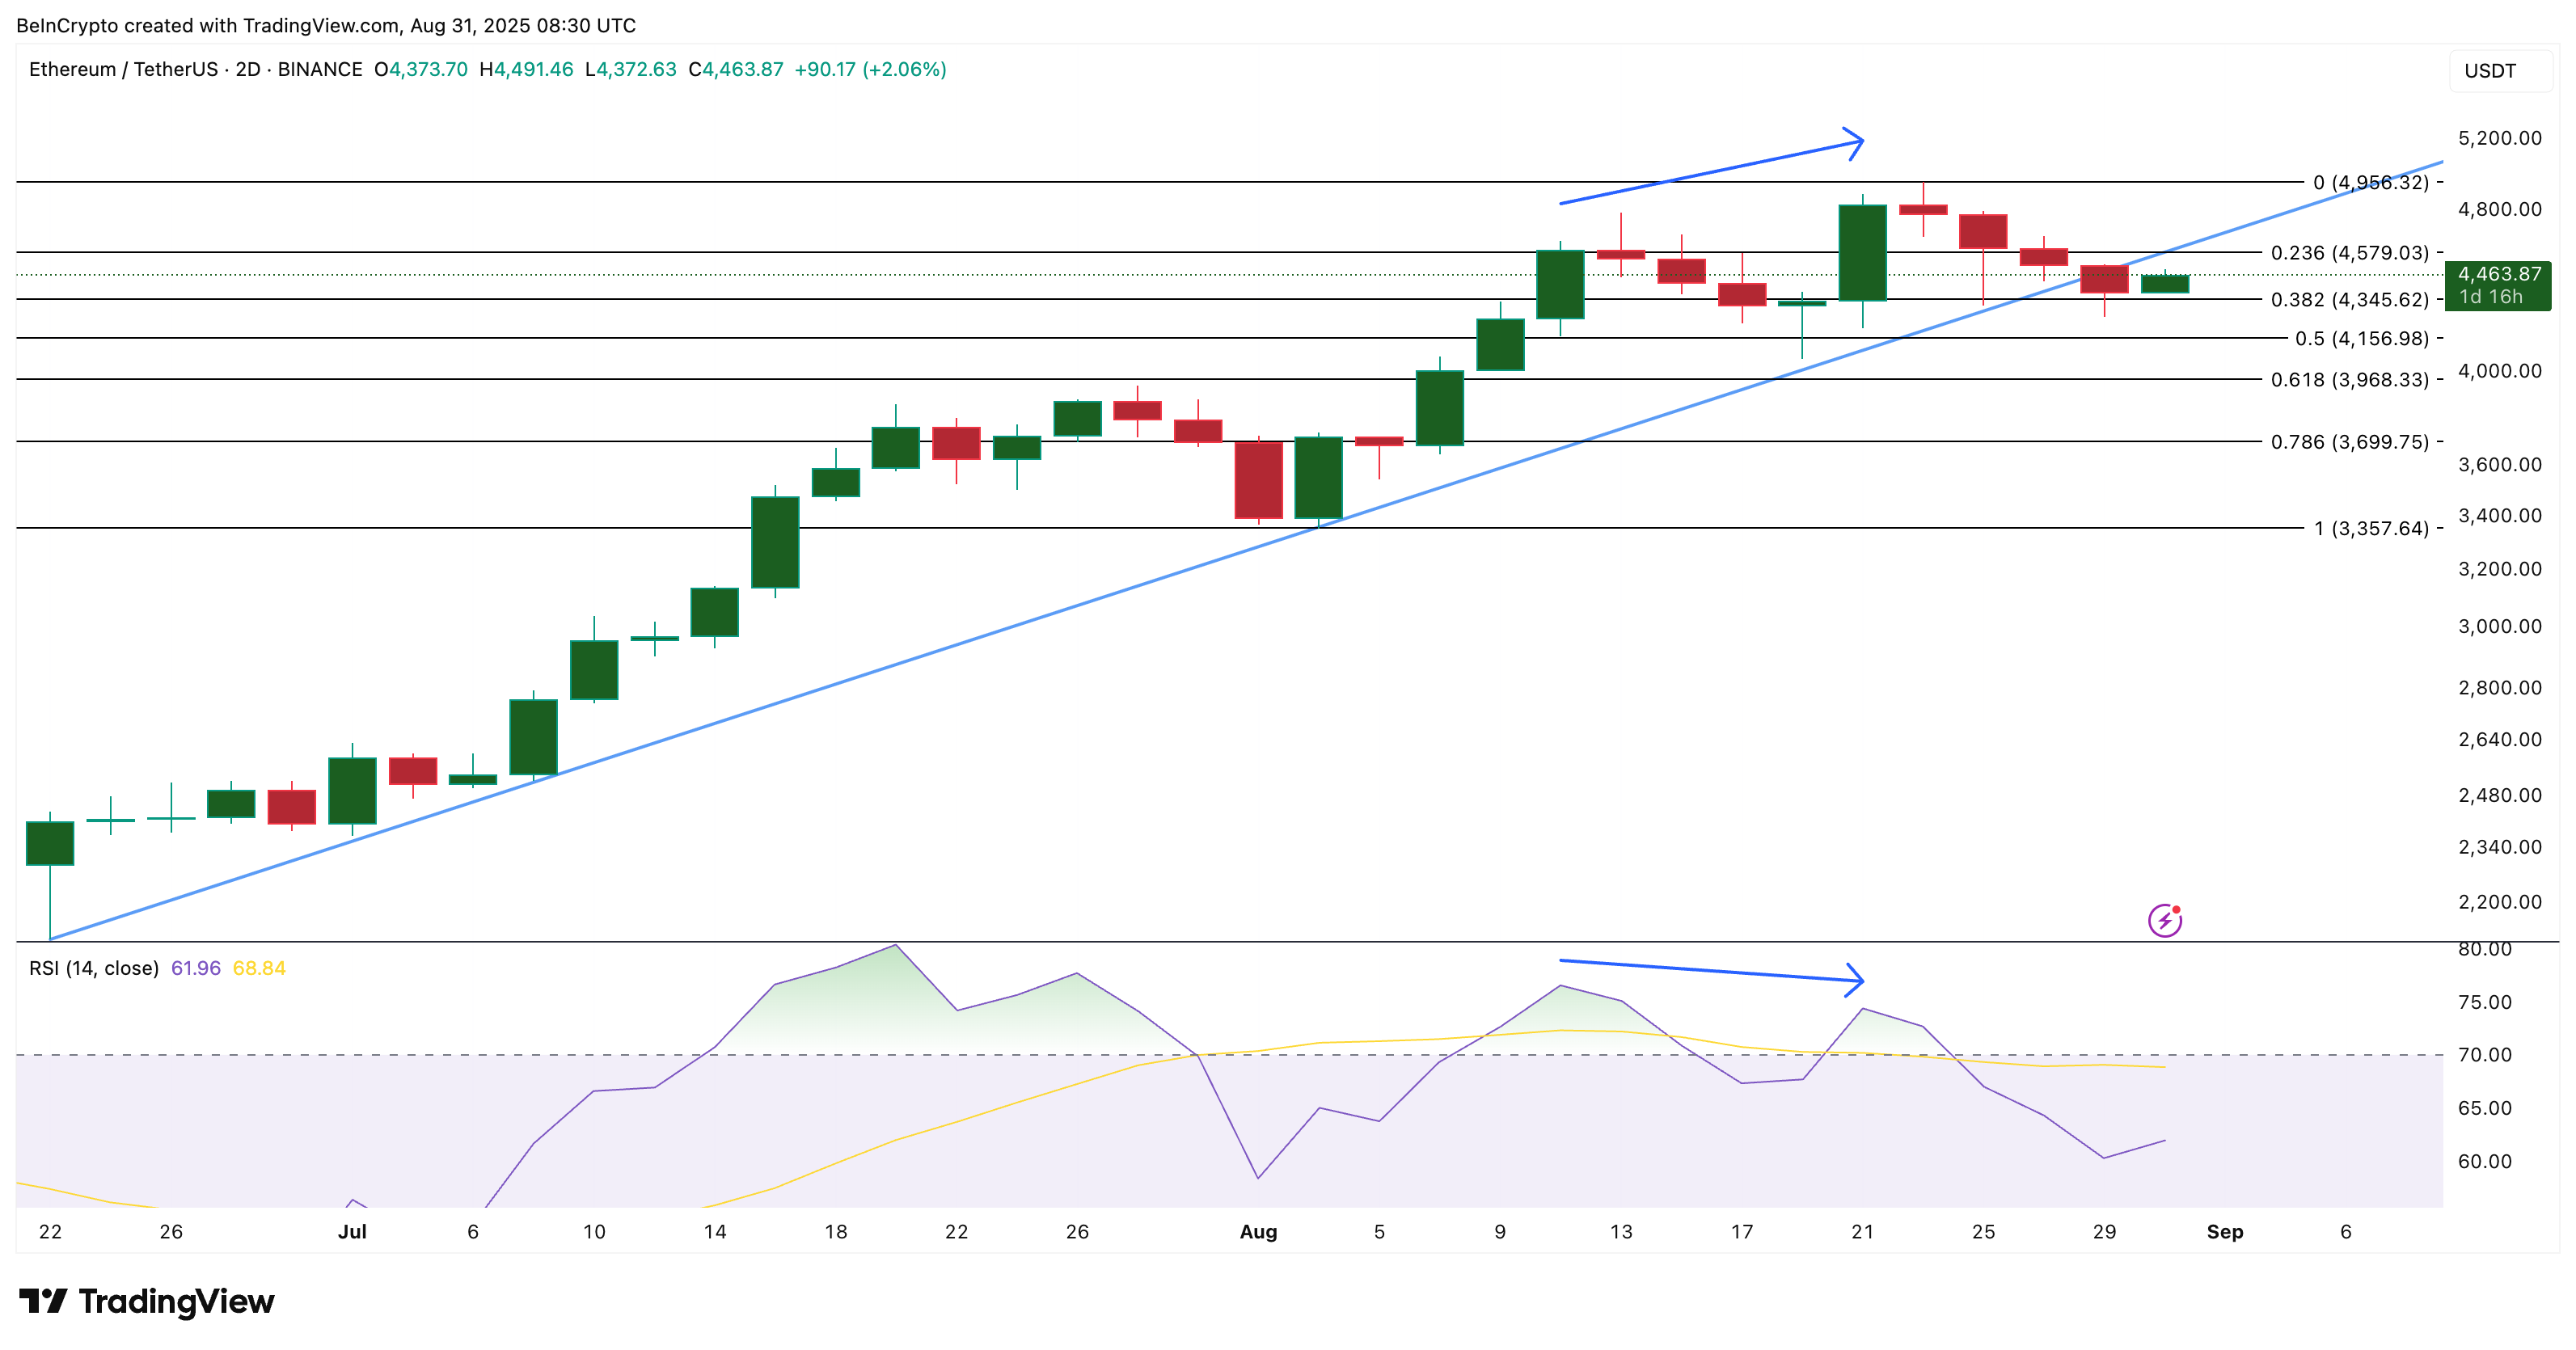
    Ethereum Price Analysis
    Ethereum Price Analysis: TradingView

    If ETH reclaims $4,579 (almost breaking through the cost basis resistance), upside momentum could revive, with the key target at $4,956.

    On the downside, monitor $4,345 and $4,156 as significant support levels. A breach below $4,156 could lead to further downside risks, while maintaining above $4,579 keeps $4,956 (near the $5,000 psychological barrier) attainable.

    However, for Ethereum, that level could signify the beginning of something larger, as summarized by Rusher.

    “Yes, $5,000 is still a significant milestone. Psychologically, investors prefer round numbers, and it’s a new all-time high. Once ETH surpasses the $5,000 level, it will likely become a well-defended support point,” he added.

    However, if Ethereum closes below $4,156 with a full 2-day candle, the bullish outlook may take longer to materialize.

    With long-term holder NUPL nearing three-month peaks, the discussion of volatility becomes even more relevant.

    Disclaimer

    As per the Trust Project guidelines, this price analysis article is meant for informational purposes only and should not be considered financial or investment advice. BeInCrypto adheres to accurate, unbiased reporting, but market dynamics can change without notice. Always perform your own research and seek professional advice before making any financial decisions. Please note that our Terms and Conditions, Privacy Policy, and Disclaimers have been revised.

    Anticipated Ethereum Price September Trends
    Share. Facebook Twitter Pinterest LinkedIn Tumblr Email
    Avatar photo
    Ethan Carter

      Ethan is a seasoned cryptocurrency writer with extensive experience contributing to leading U.S.-based blockchain and fintech publications. His work blends in-depth market analysis with accessible explanations, making complex crypto topics understandable for a broad audience. Over the years, he has covered Bitcoin, Ethereum, DeFi, NFTs, and emerging blockchain trends, always with a focus on accuracy and insight. Ethan's articles have appeared on major crypto portals, where his expertise in market trends and investment strategies has earned him a loyal readership.

      Related Posts

      Reasons for Liquidation Risks Facing SOL, TAO, and COAI This Week

      October 20, 2025

      Institutions Capitalize on Price Drops During October Crypto Market Volatility

      October 20, 2025

      Why the Struggles of October Might Continue

      October 20, 2025
      Bitcoin

      Spot Bitcoin ETFs experience $1.23 billion in weekly withdrawals, with supply dropping to a six-year low.

      By Ethan CarterOctober 20, 20250

      In a week marked by significant turmoil, including record outflows from U.S. Bitcoin ETFs and…

      DeFi

      BTC Entering ‘Reaccumulation Stage’ Amid Fed Easing Expectations and Changes in Trump Tariffs: Crypto Daybook Americas

      By Ethan CarterOctober 20, 20250

      By Francisco Rodrigues (All times ET unless indicated otherwise)Bitcoin BTC$110,765.53 and the broader crypto market…

      Regulation

      Dorsey’s Tweet on ‘Bitcoin vs. Crypto’ Ignites Community Discussion

      By Ethan CarterOctober 20, 20250

      Jack Dorsey, the founder of Twitter and a staunch advocate for Bitcoin, has sparked renewed…

      Markets

      Reasons for Liquidation Risks Facing SOL, TAO, and COAI This Week

      By Ethan CarterOctober 20, 20250

      Despite a decline in total open interest within the crypto market in October, indicating a…

      Recent Posts
      • Spot Bitcoin ETFs experience $1.23 billion in weekly withdrawals, with supply dropping to a six-year low.
      • BTC Entering ‘Reaccumulation Stage’ Amid Fed Easing Expectations and Changes in Trump Tariffs: Crypto Daybook Americas
      • Dorsey’s Tweet on ‘Bitcoin vs. Crypto’ Ignites Community Discussion
      • Reasons for Liquidation Risks Facing SOL, TAO, and COAI This Week
      • DefiLlama Reintroduces Aster Following a Data Accuracy Controversy

      At MainCoin.Money, we cover everything from Bitcoin and Ethereum to the latest trends in Altcoins, DeFi, NFTs, blockchain technology, market movements, and global crypto regulations.

      Whether you’re a seasoned investor, a blockchain developer, or just curious about digital assets, our mission is to make crypto news accessible and reliable for everyone.

      Facebook X (Twitter) Instagram Pinterest YouTube
      Top Insights

      Spot Bitcoin ETFs experience $1.23 billion in weekly withdrawals, with supply dropping to a six-year low.

      October 20, 2025

      BTC Entering ‘Reaccumulation Stage’ Amid Fed Easing Expectations and Changes in Trump Tariffs: Crypto Daybook Americas

      October 20, 2025

      Dorsey’s Tweet on ‘Bitcoin vs. Crypto’ Ignites Community Discussion

      October 20, 2025
      Get Informed

      Subscribe to Updates

      Get the latest creative news from FooBar about art, design and business.

      Facebook X (Twitter) Instagram Pinterest
      • About Us
      • Contact us
      • Privacy Policy
      • Disclaimer
      • Terms and Conditions
      © 2025 maincoin.money. All rights reserved.

      Type above and press Enter to search. Press Esc to cancel.