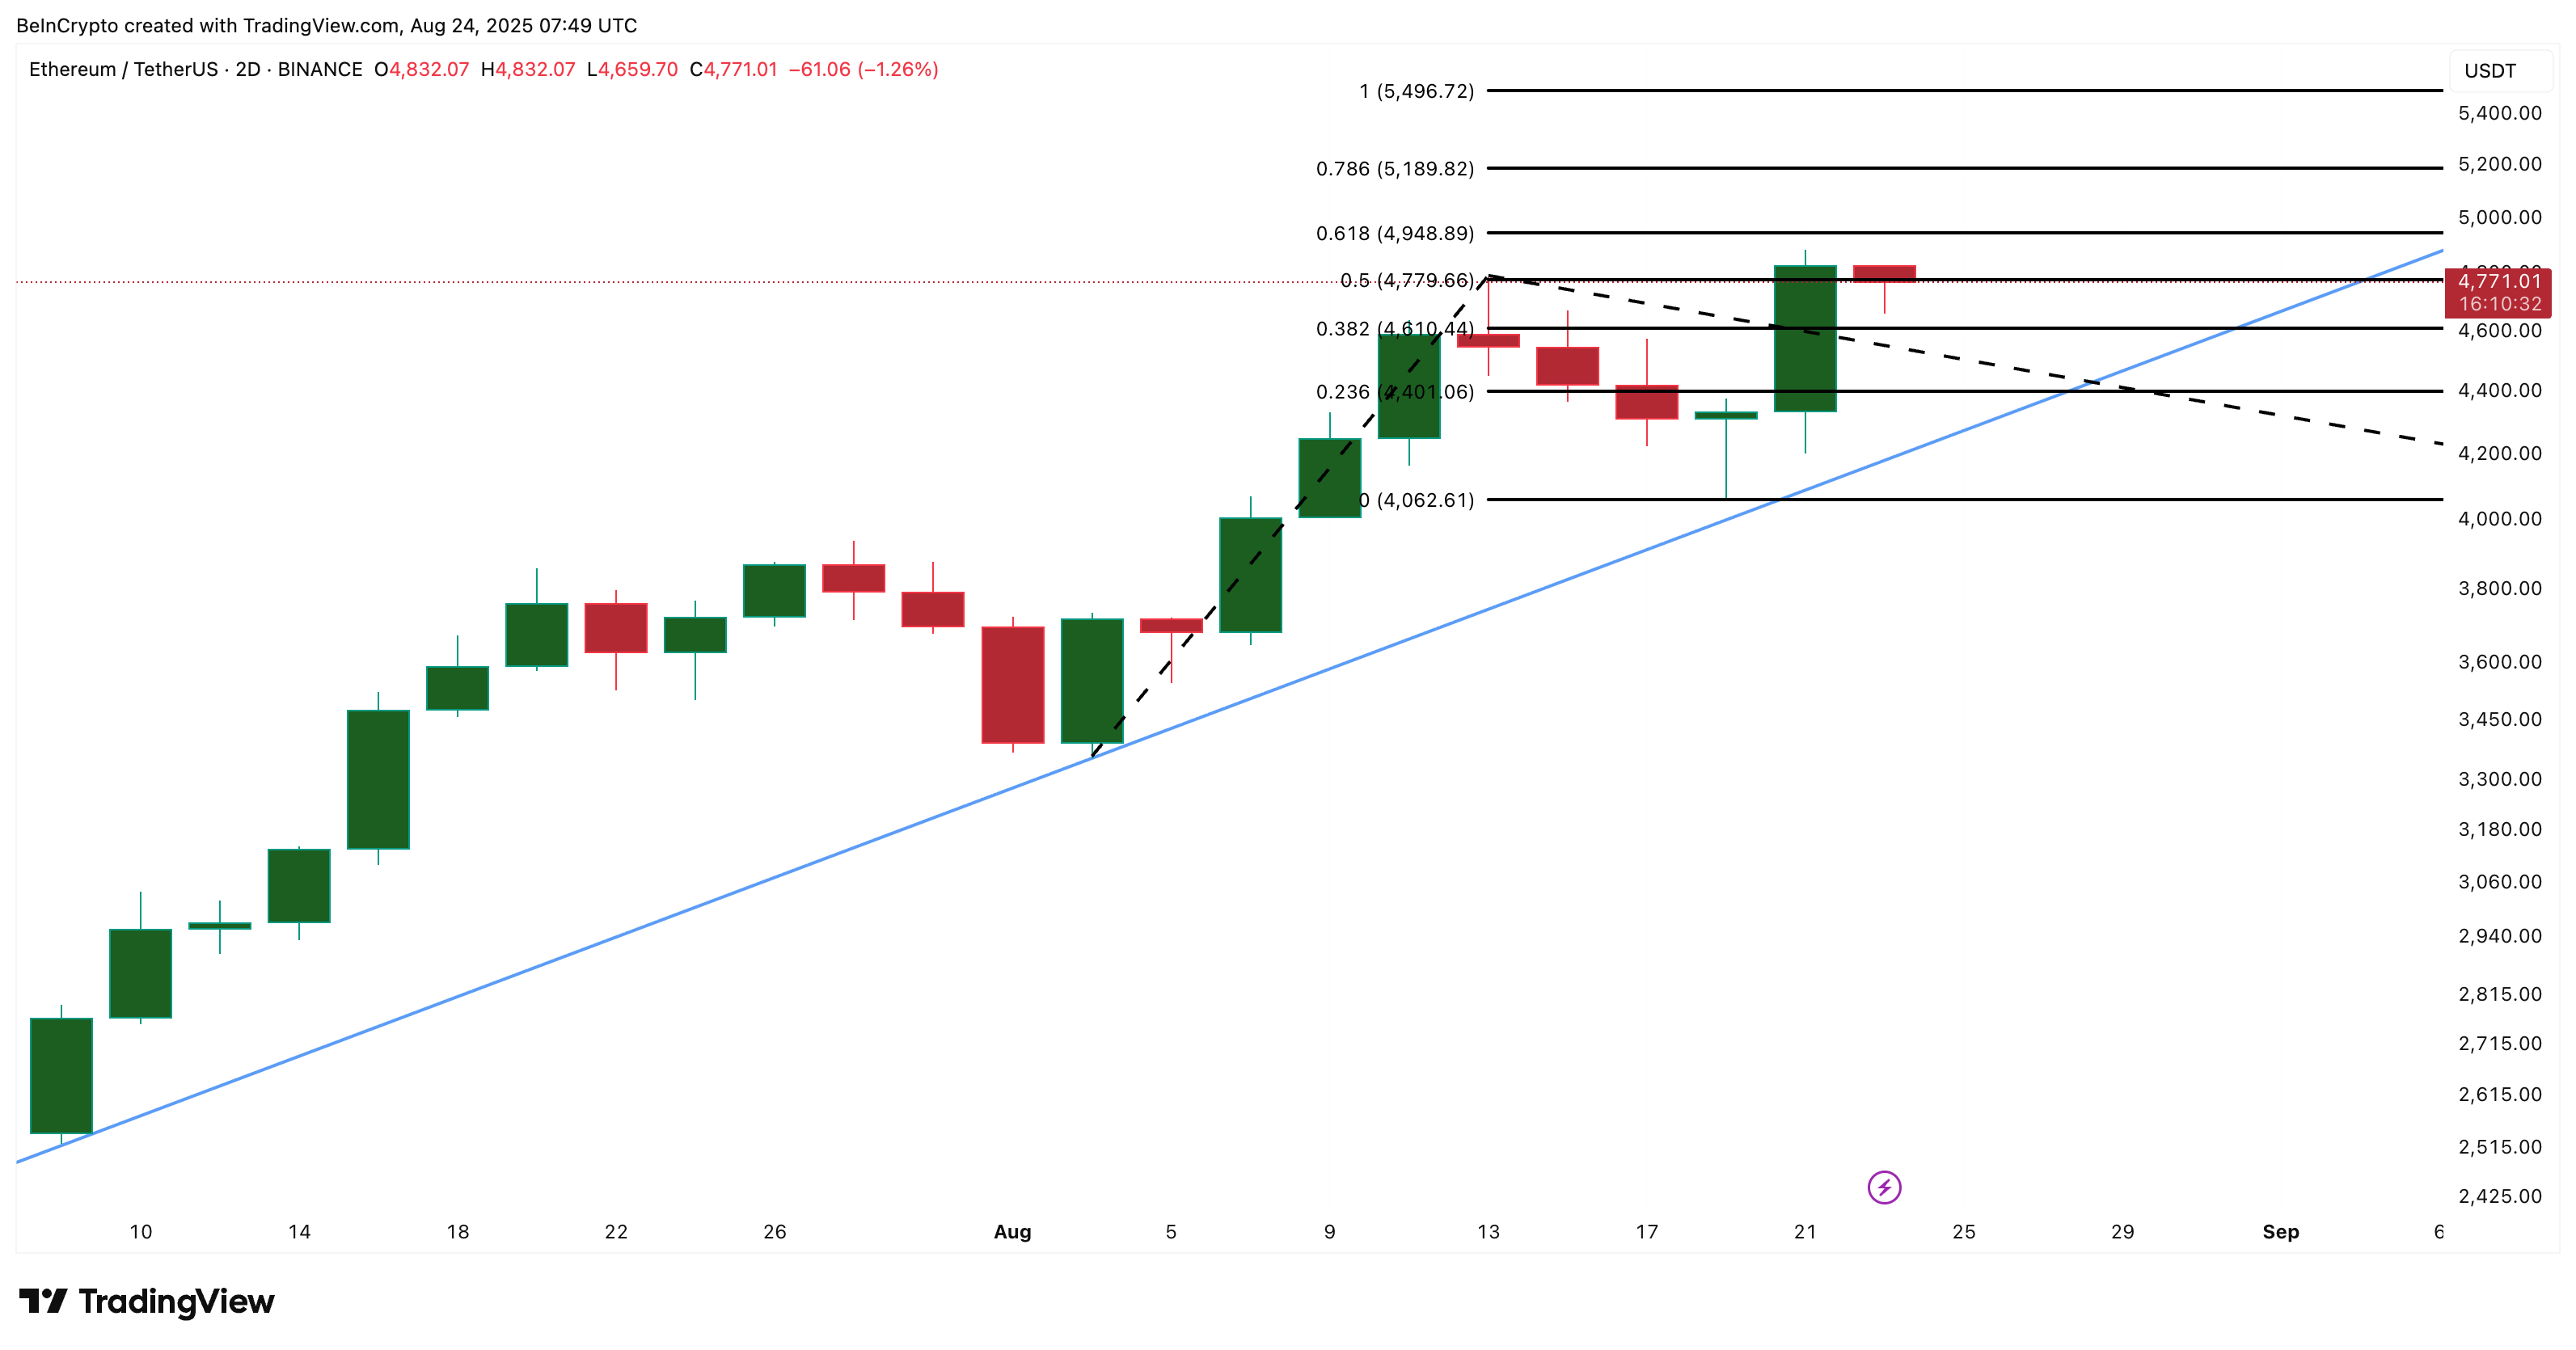
The price of Ethereum remains strong, increasing by 1.1% over the last 24 hours to approximately $4,770. The asset is trading less than 2% below its all-time high, with three-month gains at 85% and year-to-date returns exceeding 70%.
This rally has been among the most robust within significant altcoins, yet traders are considering two potential scenarios: a brief pullback or a breakout that takes ETH beyond $5,500. Both outcomes have valid reasons backing them.
Large Holders Continue to Accumulate
The price of Ethereum has shown resilience around $4,770 as major holders quietly increase their assets. Wallets containing between 1 million and 10 million ETH have raised their holdings from 7.42 million ETH ($35.39 billion) on August 19 to 7.63 million ETH ($36.39 billion) currently.
This translates to an increase of 210,000 ETH, valued at about $1.0 billion at today’s price, accumulated over the past few days.

Simultaneously, the cohort holding between 10 million and 100 million ETH increased their assets from 66.8 million ETH ($318.63 billion) to 66.94 million ETH ($319.30 billion), adding around 140,000 ETH valued at $668 million.
Such consistent accumulation, even with Ethereum near its highs, indicates a solid confidence. However, while spot buying fortifies the base, on-chain metrics suggest some profit-taking is occurring.
This is where indicators like liveliness and the cost-basis heatmap provide additional insight.
Interested in more insights about tokens? Subscribe to Editor Harsh Notariya’s Daily Crypto Newsletter here.
Liveliness Hints at a Pullback, But Limited
The Ethereum Liveliness metric, measuring the movement of coins, has surged to its highest monthly level over 0.70. Elevated liveliness signals that more long-held coins are being traded, often correlating with profit-taking.

The last spurt in liveliness occurred in early August when Ethereum plummeted from $4,748 to $4,077 in a matter of days. Although a similar decline might be anticipated, it could be less drastic due to stronger demand zones below.
A potential reason for any limited pullback is visible in Ethereum’s Cost Basis Distribution Heatmap, illustrating where coins have changed hands and highlighting significant price zones of concentrated ETH buying activity.

Three notable clusters have emerged:
- $4,592–$4,648 with nearly 866,000 ETH
- $4,648–$4,704 with about 700,000 ETH
- $4,704–$4,761 with around 545,000 ETH
These accumulation layers indicate significant demand between $4,590 and $4,761. Should ETH dip into this range, buyers are likely to quickly absorb the selling pressure, minimizing downside risks. This dynamic is especially clear with large holders, including whales, who acquired ETH during the rally and may do so again if prices fall slightly.
Key Ethereum Price Levels to Watch
From a technical analysis standpoint, Ethereum recently honored the 0.618 Fibonacci extension at $4,948, frequently a strong resistance level. A decisive daily close beyond this point could pave the way toward the 1.0 extension at $5,496, effectively the $5,500 landmark.

If the price fails to maintain the $4,610 area, which coincides with both Fibonacci support and cost basis clusters, it may drop toward $4,400. However, this would necessitate ETH whales and other large holders to sell, which doesn’t appear likely at this stage.
The post Will Ethereum Price Pullback or Rally Towards $5,500? appeared first on BeInCrypto.

