Pi Coin price has declined by nearly 1% in the last 24 hours and is down 6.5% over the past week, underperforming the broader market.
While most tokens tend to experience short-lived rebounds during corrections, technical and on-chain signals indicate that PI’s downtrend is far from over.
Buyers Fail to Regain Control as Selling Pressure Persists
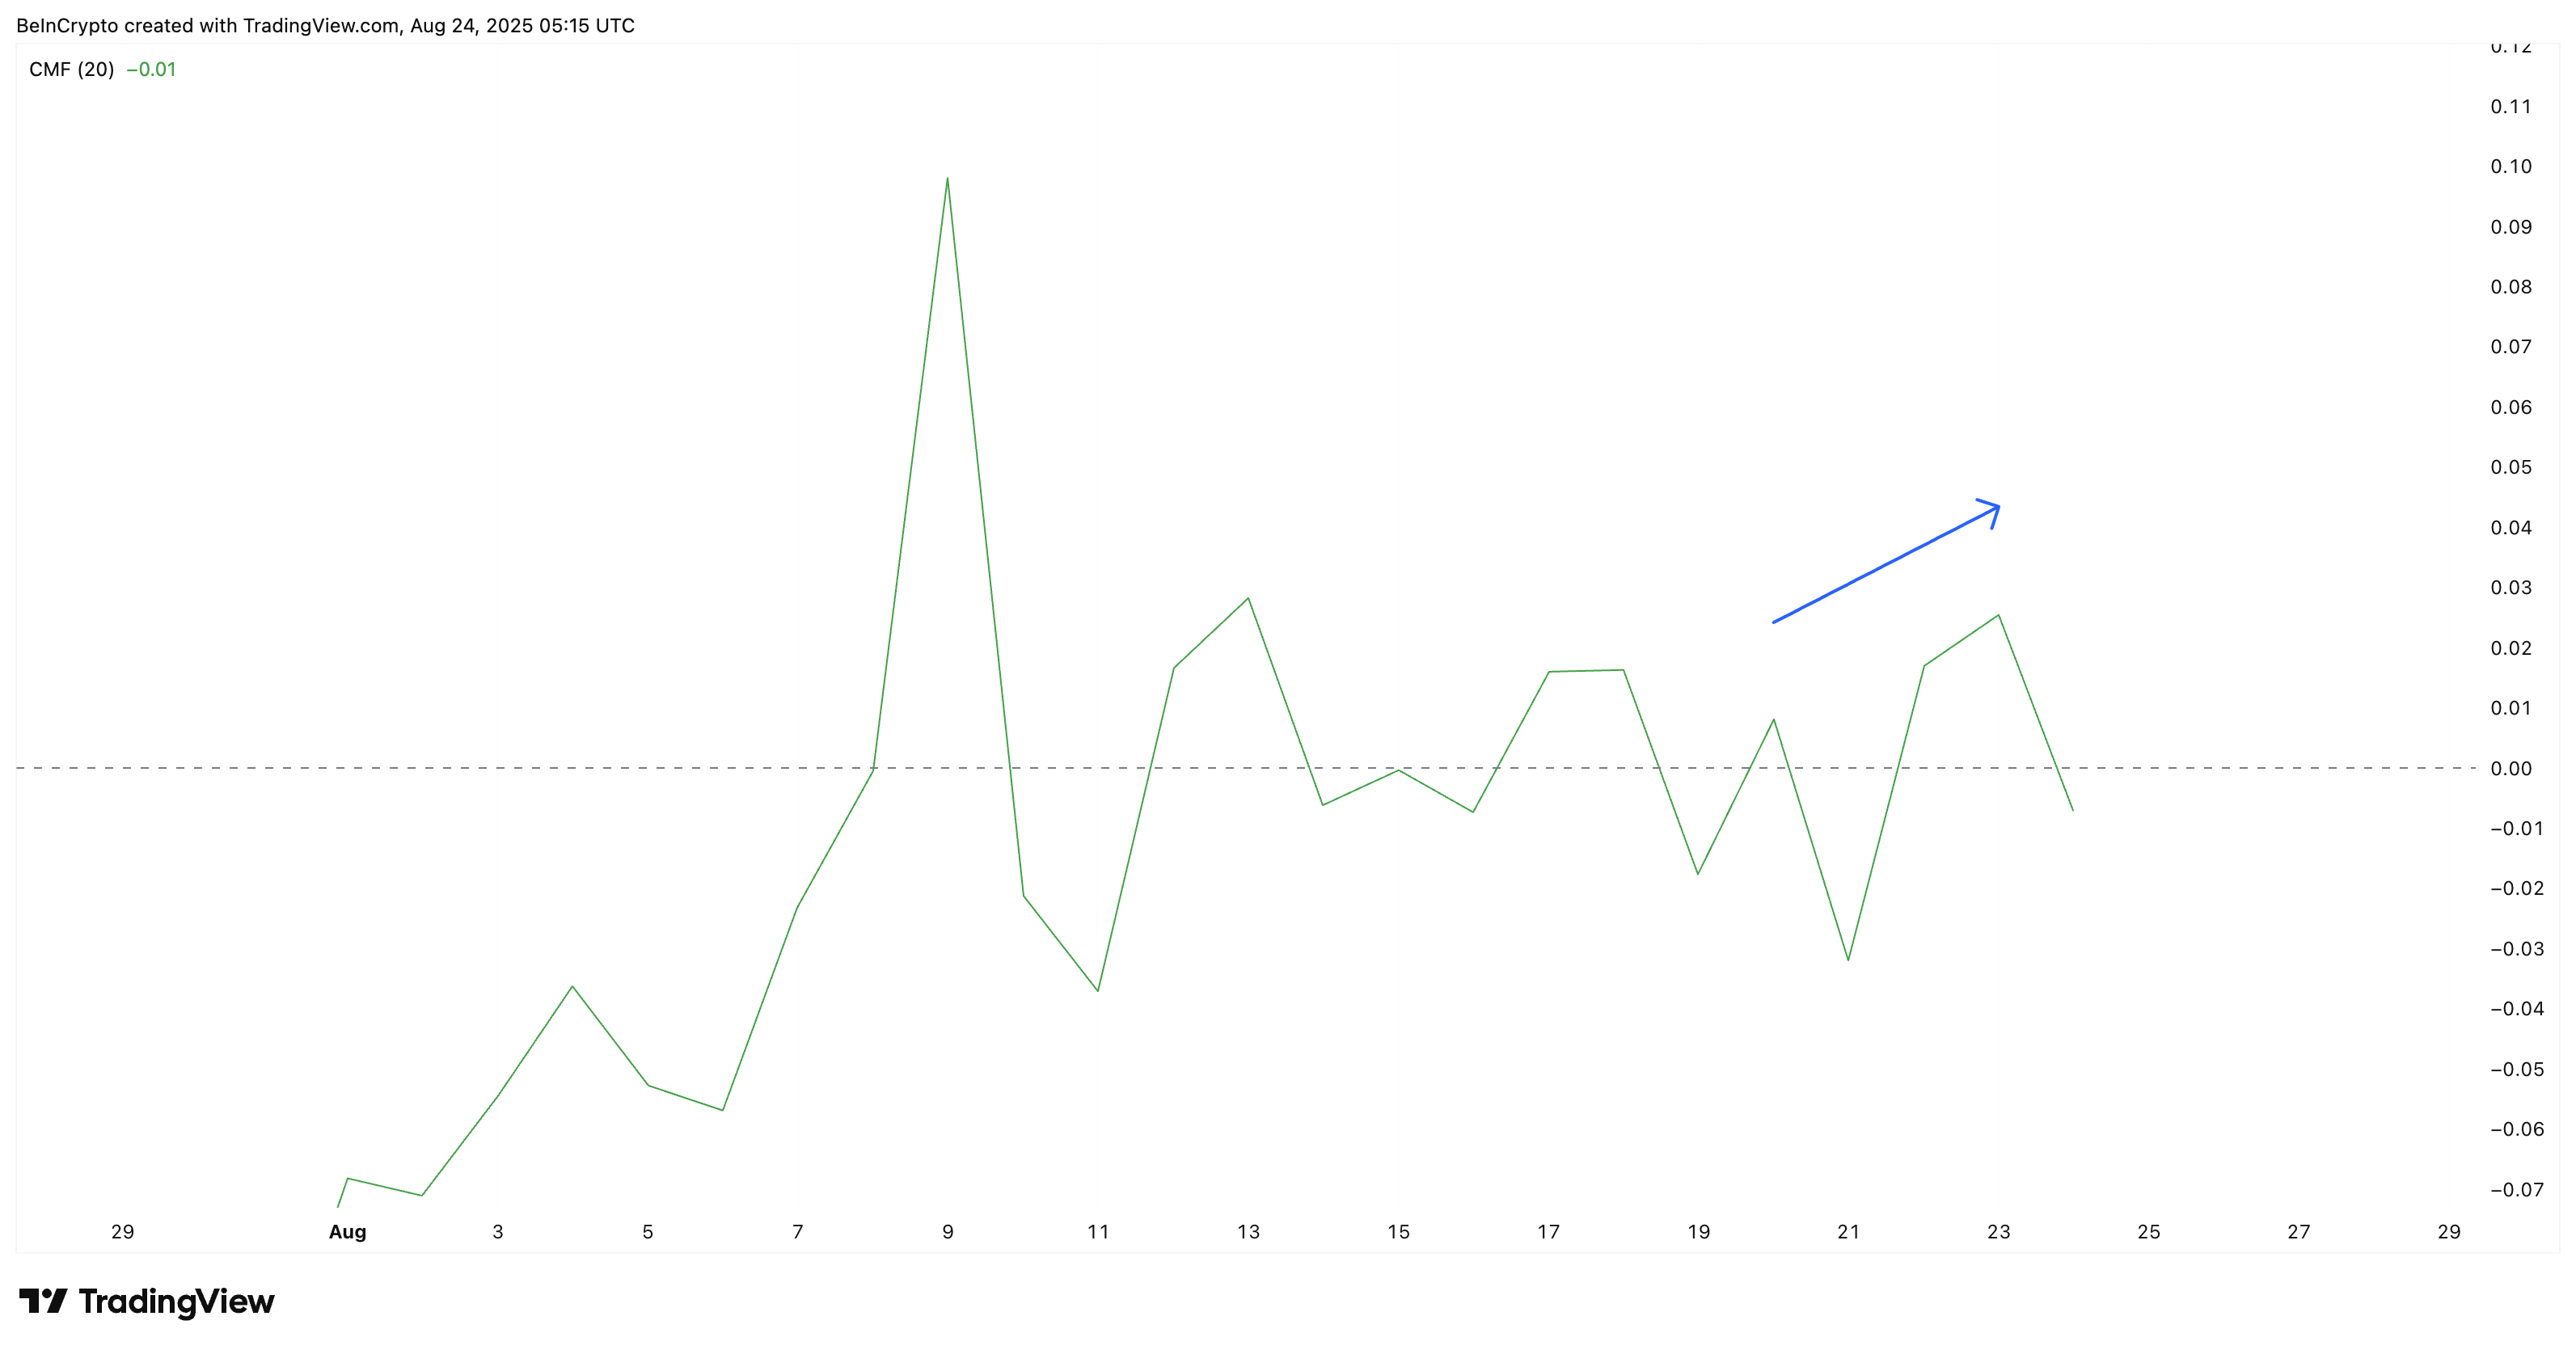
The Chaikin Money Flow (CMF), which tracks capital inflows and outflows, briefly rose earlier in August, suggesting increased demand. However, the latest reading has fallen back below zero, confirming that selling pressure still exceeds capital inflows.
For PI, this shift indicates that buyers attempted to regain control but could not maintain it.

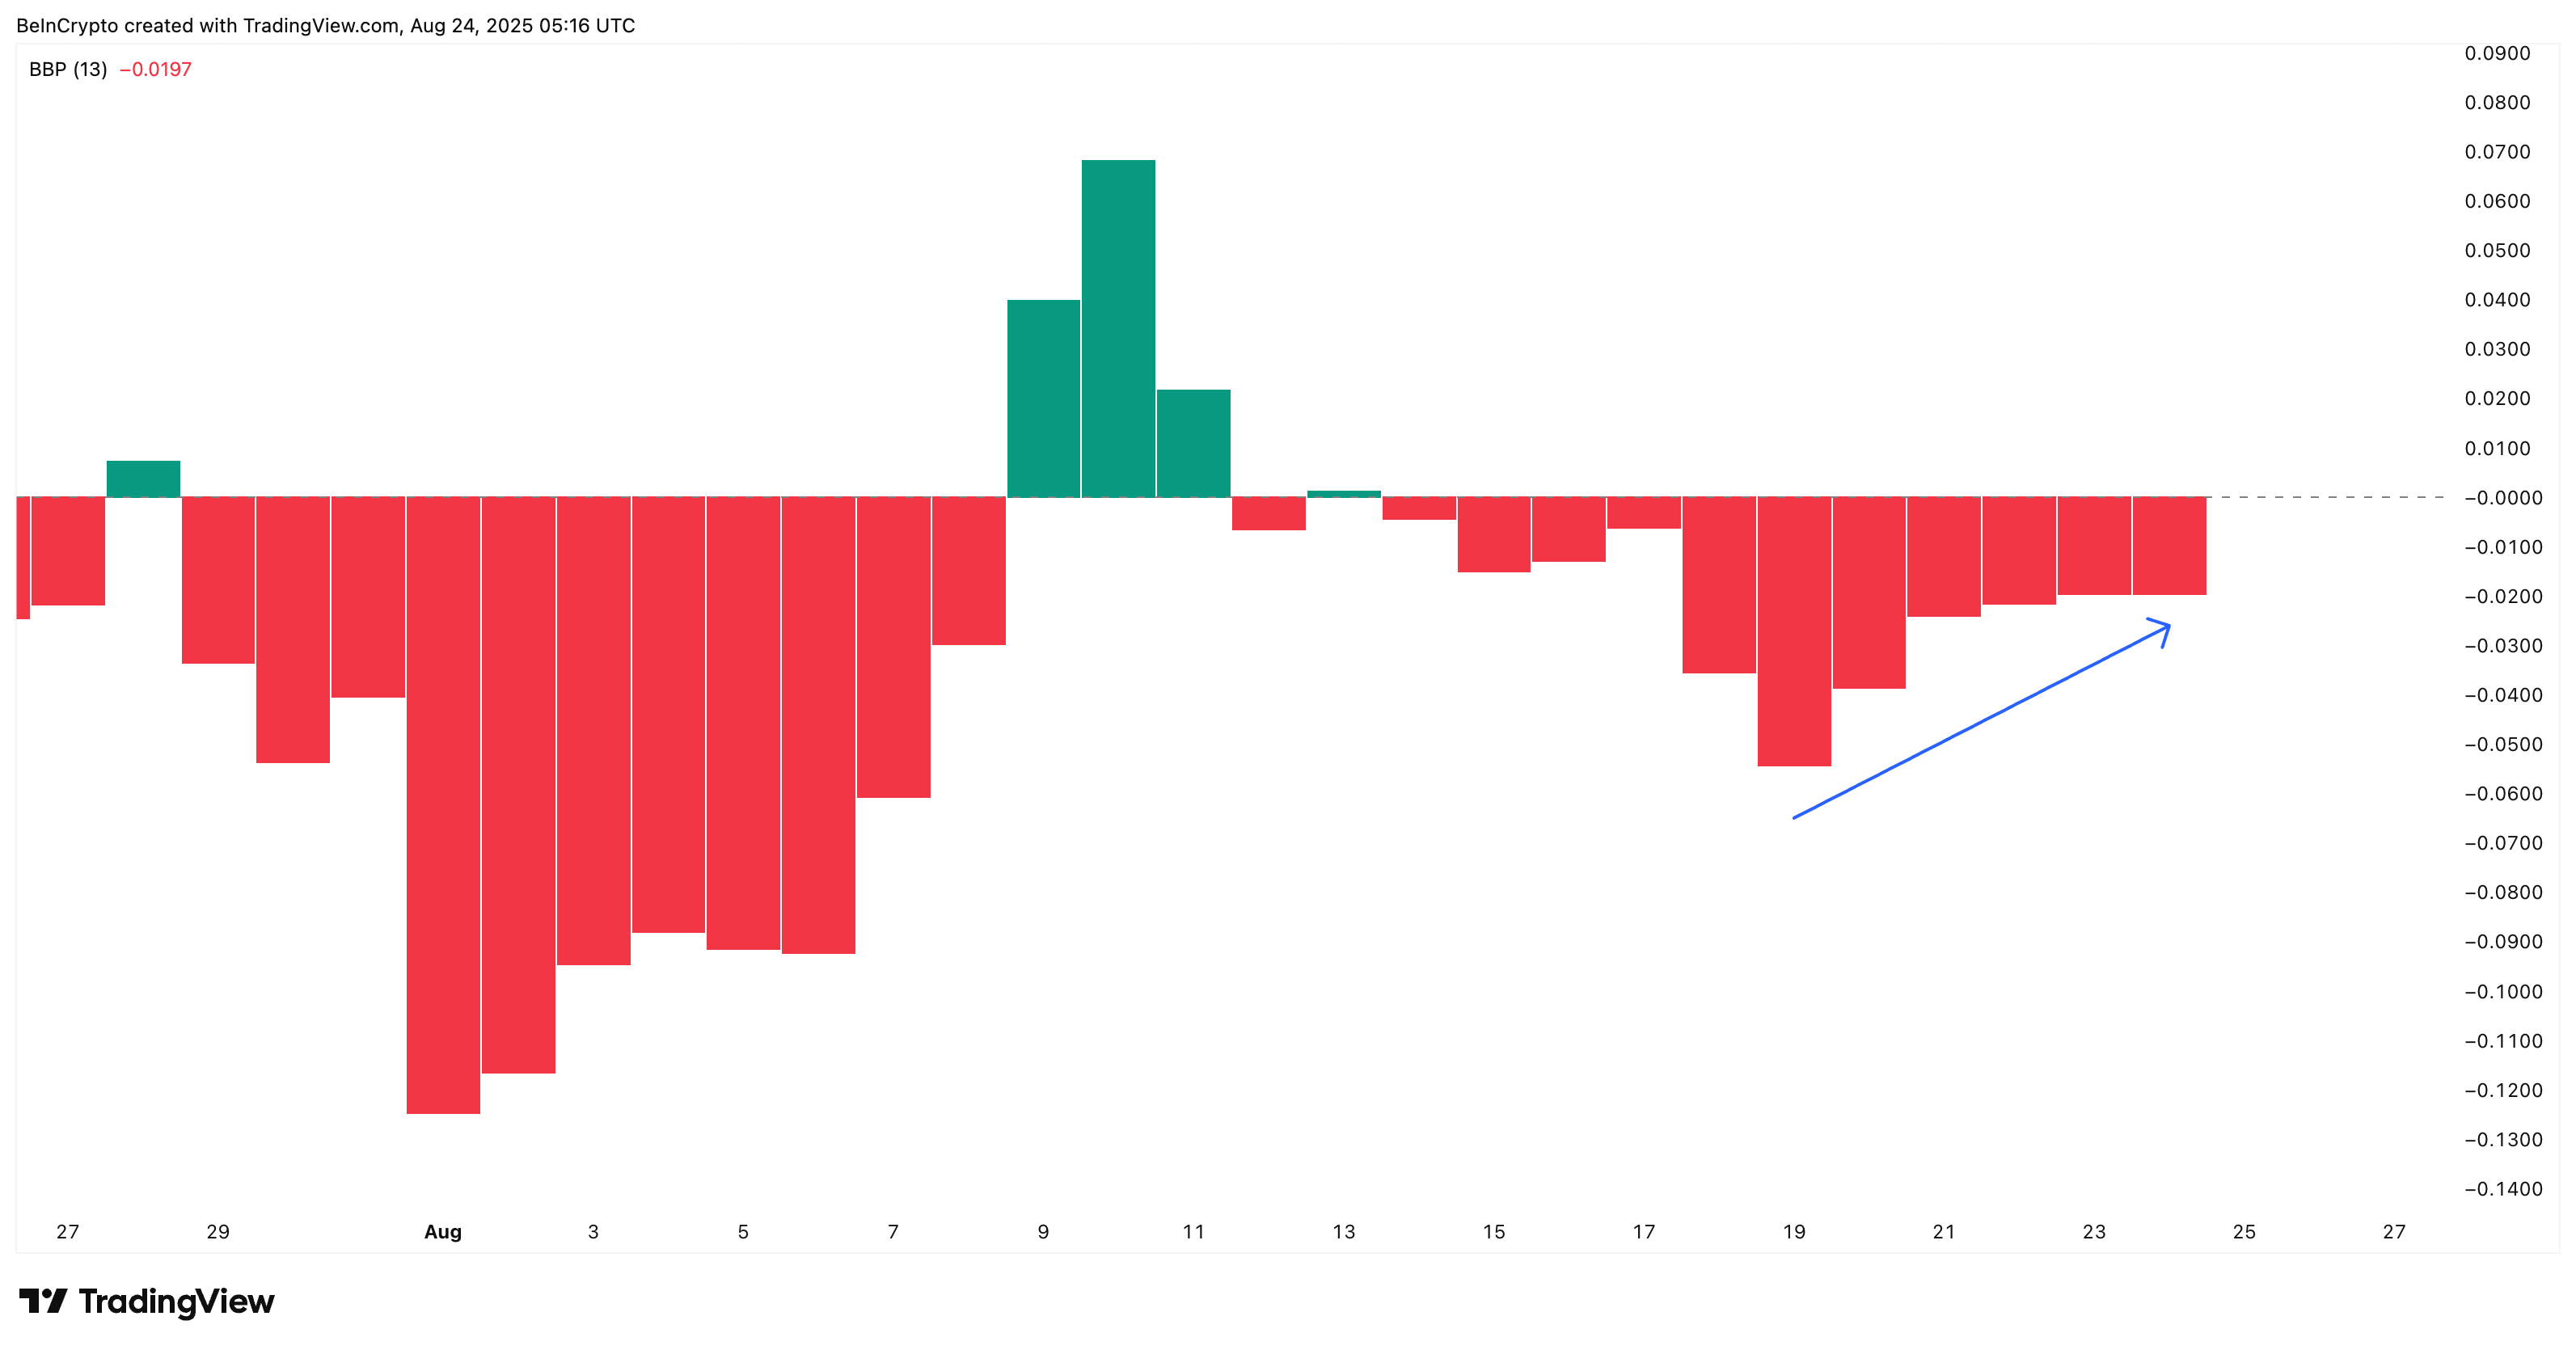
The Bull Bear Power (BBP) further reinforces the bearish outlook. It’s an indicator that determines whether buyers (bulls) or sellers (bears) dominate the market.
While the indicator shows a slight easing of bearish strength, the last two sessions have remained flat, suggesting that bulls attempted a rally but were unable to overtake sellers.

Combined with CMF’s negative reading, the data suggests that selling pressure is still firmly dominant, despite buyers trying to counter the bearish trend.
Want more token insights like this? Sign up for Editor Harsh Notariya’s Daily Crypto Newsletter here.
Hidden Divergence Confirms Bearish Bias As Key PI Price Levels Come In Focus
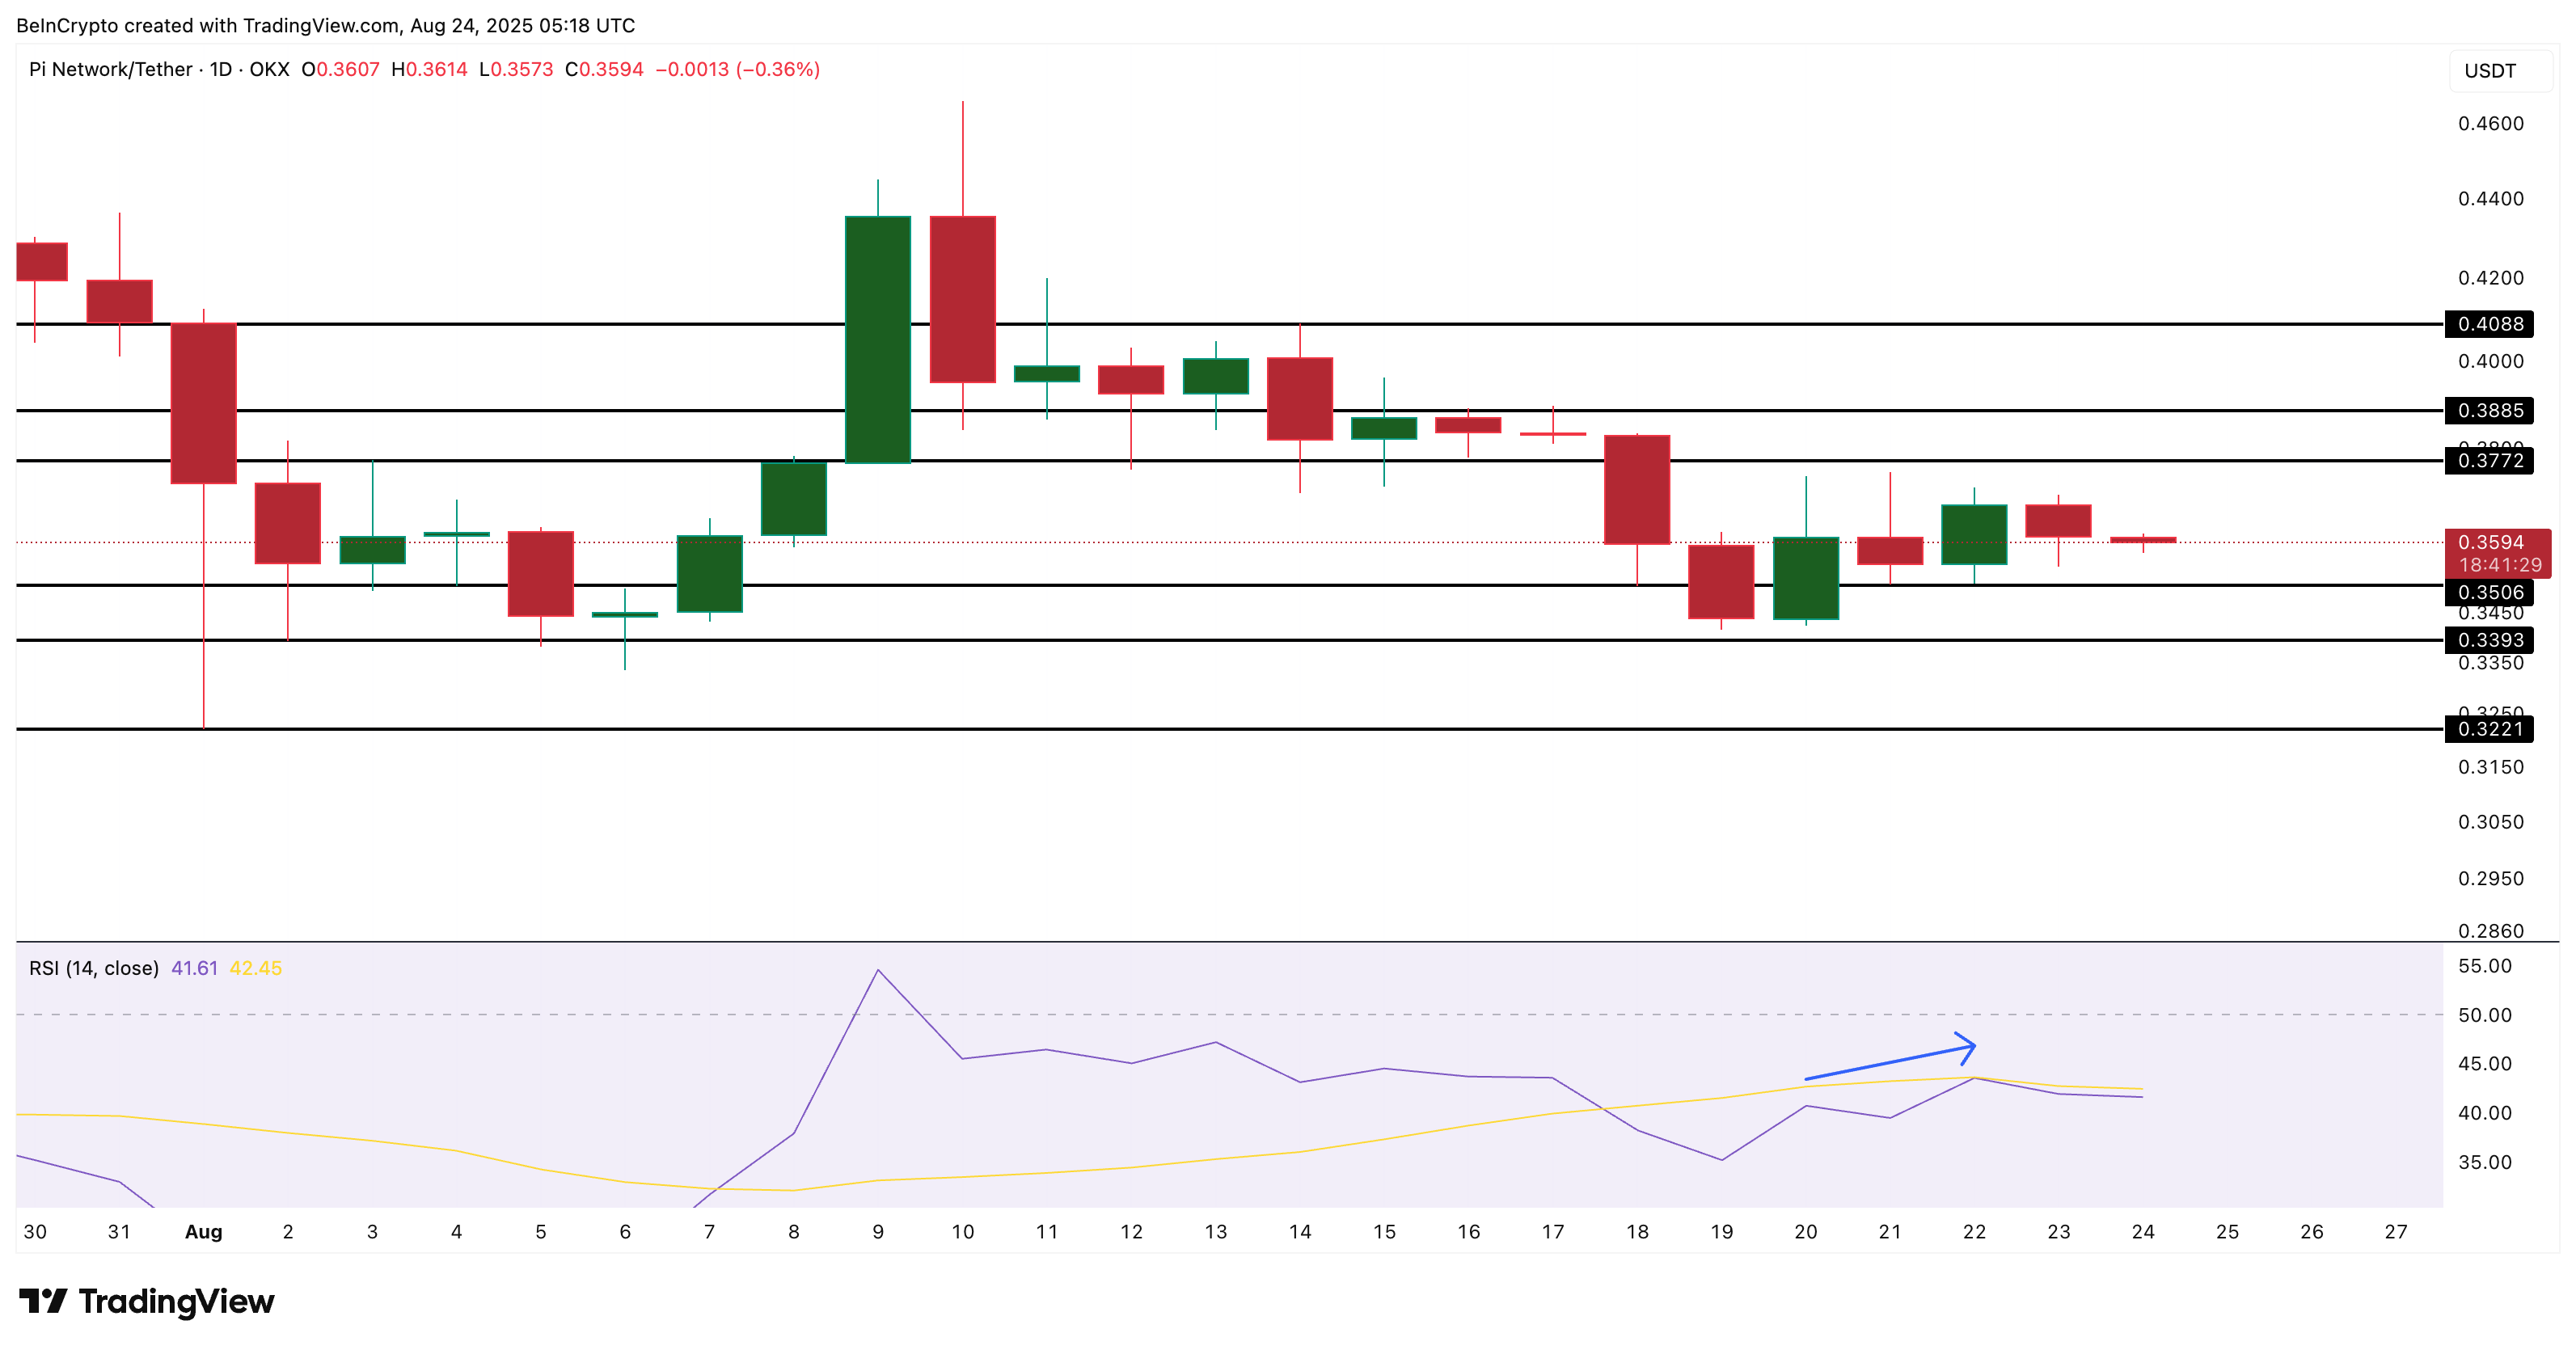
The weakness observed in CMF and BBP is mirrored by momentum signals. The Relative Strength Index (RSI) has formed a hidden bearish divergence.
This indicates that while PI’s price chart shows lower highs, the RSI recorded higher highs around the mid-40s. This disconnect suggests that momentum isn’t leading to upward price movement, reinforcing the bearish bias.
The Relative Strength Index (RSI) measures the speed and strength of price moves, indicating whether an asset is overbought or oversold. Hidden bearish divergence occurs when the price makes lower highs while the RSI makes higher highs.
This indicates that even though momentum appears stronger, sellers continue to control the trend, and the downward trend is likely to persist.

This type of hidden bearish divergence emphasizes the continuation of the downtrend for the Pi Coin price. The pattern emerging on the daily chart (longer timeframe) might be the key reason a new Pi Coin price low is on the horizon.
Currently trading around $0.359, the PI price has strong support at $0.350. A breakdown below this level could escalate losses toward $0.339 and $0.322, with fresh all-time lows likely if $0.322 is broken.
On the upside, bulls would need to reclaim $0.377 and then $0.408 to reverse the structure; a move that seems improbable unless inflows return decisively.
The post Pi Coin Price Might Record Another All-Time Low As Key Indicators Turn Bearish appeared first on BeInCrypto.

