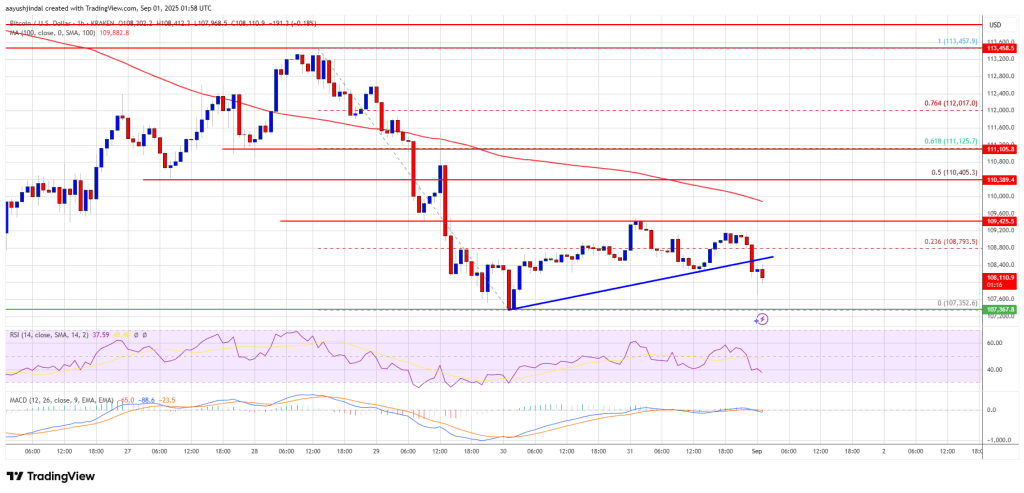
The price of Bitcoin is currently exhibiting bearish trends under $112,000. BTC is facing challenges in its recovery and may soon initiate another decline beneath the $108,000 level.
- Bitcoin has entered a new decline below the $112,550 mark.
- The price is trading below $111,000 and is under the 100 hourly Simple Moving Average.
- A bearish trend line was breached, which had support at $108,450 on the hourly chart of the BTC/USD pair (data sourced from Kraken).
- If the pair breaks below the $108,000 support zone, it may trigger another decline.
Bitcoin Price Dips Again
The price of Bitcoin attempted a new recovery wave from the low of $107,352. BTC managed to rise above the resistance levels of $108,000 and $108,500.
The price surpassed the 23.6% Fibonacci retracement level of the critical drop from the swing high of $113,457 to the low of $107,352. However, sellers remained active near $109,500, hindering further gains. The price is now trending lower again, falling below $109,000.
A bearish trend line with support at $108,450 was breached on the hourly BTC/USD chart. Bitcoin is currently trading below $109,000 and the 100 hourly Simple Moving Average.
Immediate upside resistance is close to the $109,400 level. The first key resistance stands around the $110,000 mark. Additional resistance might be encountered at $110,500 or at the 50% Fibonacci retracement level of the significant drop from the swing high of $113,457 to the low of $107,352.

A close above the $110,500 resistance could propel the price higher. In such a scenario, the price might test the $112,000 resistance level. Further gains could push the price toward $112,500, with the main target being $113,500.
More Losses In BTC?
If Bitcoin does not surpass the $110,500 resistance level, it may begin a new decline. Immediate support is near the $108,000 level, while the first major support is around $107,400.
The next support level is near the $106,500 zone. Additional losses could lead the price down to the $105,500 support level in the near term. The primary support lies at $103,500, and falling below this could result in a significant decline for BTC.
Technical indicators:
Hourly MACD – The MACD is currently gaining momentum in the bearish territory.
Hourly RSI (Relative Strength Index) – The RSI for BTC/USD is now below the 50 level.
Major Support Levels – $107,400, followed by $106,500.
Major Resistance Levels – $109,500 and $110,500.

