API3, the native token of the decentralized oracle solution Api3, surged by up to 102% in the last week, primarily driven by its listing on one of Korea’s largest crypto exchanges.
Summary
- API3 has risen over 100% following its listing on Upbit.
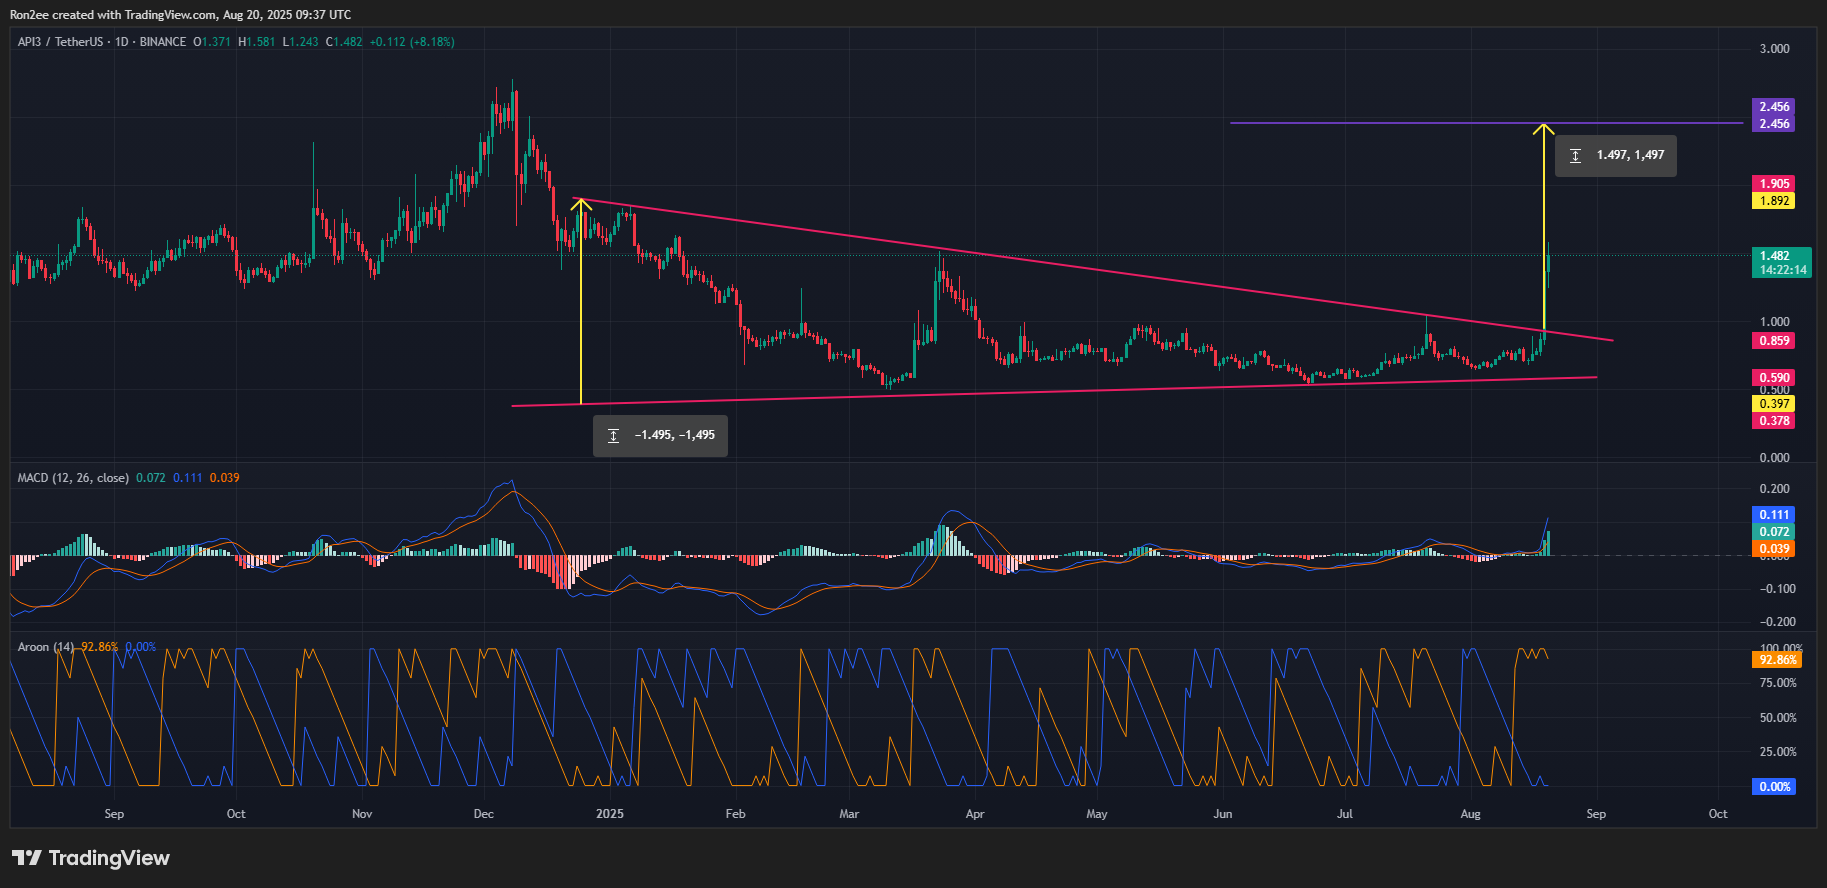
- The token may aim for $2.45 next after breaking out of a symmetrical triangle.
As reported by crypto.news, Api3 (API3) reached a 7-month peak of $1.69 on August 19, before stabilizing at $1.55 at the time of writing. At this price, it is nearly 200% above its year-to-date low.
The API3 token’s rise was accompanied by a significant increase in daily trading volume, which shot up by 400% in the past 24 hours, reflecting strong interest from investors. Additionally, CoinGlass data indicates that its open interest has reached an all-time high of $111.3 million, with the long/short ratio exceeding 1, signaling that more traders are poised for further gains.
In just a week, the token’s market capitalization has nearly doubled, climbing from $100 million to $197 million.
API3’s impressive gains coincide with its listing on Upbit, South Korea’s premier cryptocurrency exchange, on August 19.
It is not unusual for cryptocurrencies to experience significant price rallies post major exchange listings. This was evident on Upbit, which recorded a peak daily trading volume of $302.9 million, surpassing Binance’s $93.4 million by more than three times.
However, such trends often witness a retracement as the initial excitement fades. For instance, as previously noted by crypto.news, the native token of Omni Network, OMNI, skyrocketed over 120% after a similar Upbit listing but lost the majority of its gains within a week.
Thus, API3 could encounter similar challenges and may retract its recent advances unless a significant bullish impetus arises.
As of now, API3 is down more than 18% from its weekly high of $1.82 reached on the day of its Upbit listing.
In the daily price chart, API3 has been forming a symmetrical triangle pattern since the start of the year. This formation arises when price action consolidates between a series of lower highs and higher lows, indicating a period of consolidation before a possible breakout.

A breakout above the upper trendline typically indicates the beginning of a bullish trend, while a decline below the lower trendline often suggests renewed bearish pressure.
In the case of API3, the token has confirmed a strong breakout above the upper boundary, driven by momentum following its recent Upbit listing. Technical indicators support this bullish interpretation.
The Aroon Up is at 92.86%, and the Aroon Down is at 0%, clearly indicating that upward momentum is commanding the market. Likewise, the MACD has shifted positively, with both lines trending upward and green histogram bars expanding, indicating that buyers are in control.
The next target for API3 is $2.45, based on the prospective trajectory from the pattern breakout, representing a potential increase of about 58% from its current price.
Disclosure: This article does not constitute investment advice. The content and materials presented on this page are strictly for educational purposes.

