Hedera (HBAR) has faced ongoing pressure through late August, continuing its decline into September. Over the month, the HBAR price has decreased by 8.8%, marking a persistent downtrend that began in mid-August. This correction follows a remarkable rally earlier in the year, during which HBAR saw an increase of over 350%, a momentum that now appears to be a distant memory.
Despite this weakness, some large investors have started to quietly increase their holdings, indicating that not all market participants are feeling bearish. However, technical indicators are advising caution.
Whales Accumulate Over $11 Million In HBAR
On-chain data reveals that whales have been progressively accumulating Hedera, despite the token’s declining price. In the last week, two significant groups — wallets holding at least 1 million and 10 million HBAR — have notably increased their balances.
The 1 million HBAR group grew from 84.33 to 86.30 accounts, representing an addition of at least 1.97 million tokens, valued at around $445,000 at the current price of $0.226. The 10 million HBAR group increased from 108.62 to 113.45 accounts, amounting to at least 48.3 million tokens, worth about $10.92 million.

In total, whales have obtained over 50 million HBAR, valued at nearly $11.36 million, within the past week. This consistent buying indicates that large investors remain committed, even amidst the month-long decline in Hedera’s price.
However, whale accumulation does not necessarily lead to immediate price improvements. Retail traders, who often dominate short-term market movements, may still be in a selling mode. This is where technical signals, such as the RSI divergence, become crucial.
Interested in more token insights like this? Sign up for Editor Harsh Notariya’s Daily Crypto Newsletter here.
Hidden Bearish Divergence Clouds Outlook
The Relative Strength Index (RSI) acts as a momentum indicator that assesses whether an asset is overbought or oversold. Divergences between price trends and RSI values often serve as early warning indicators.

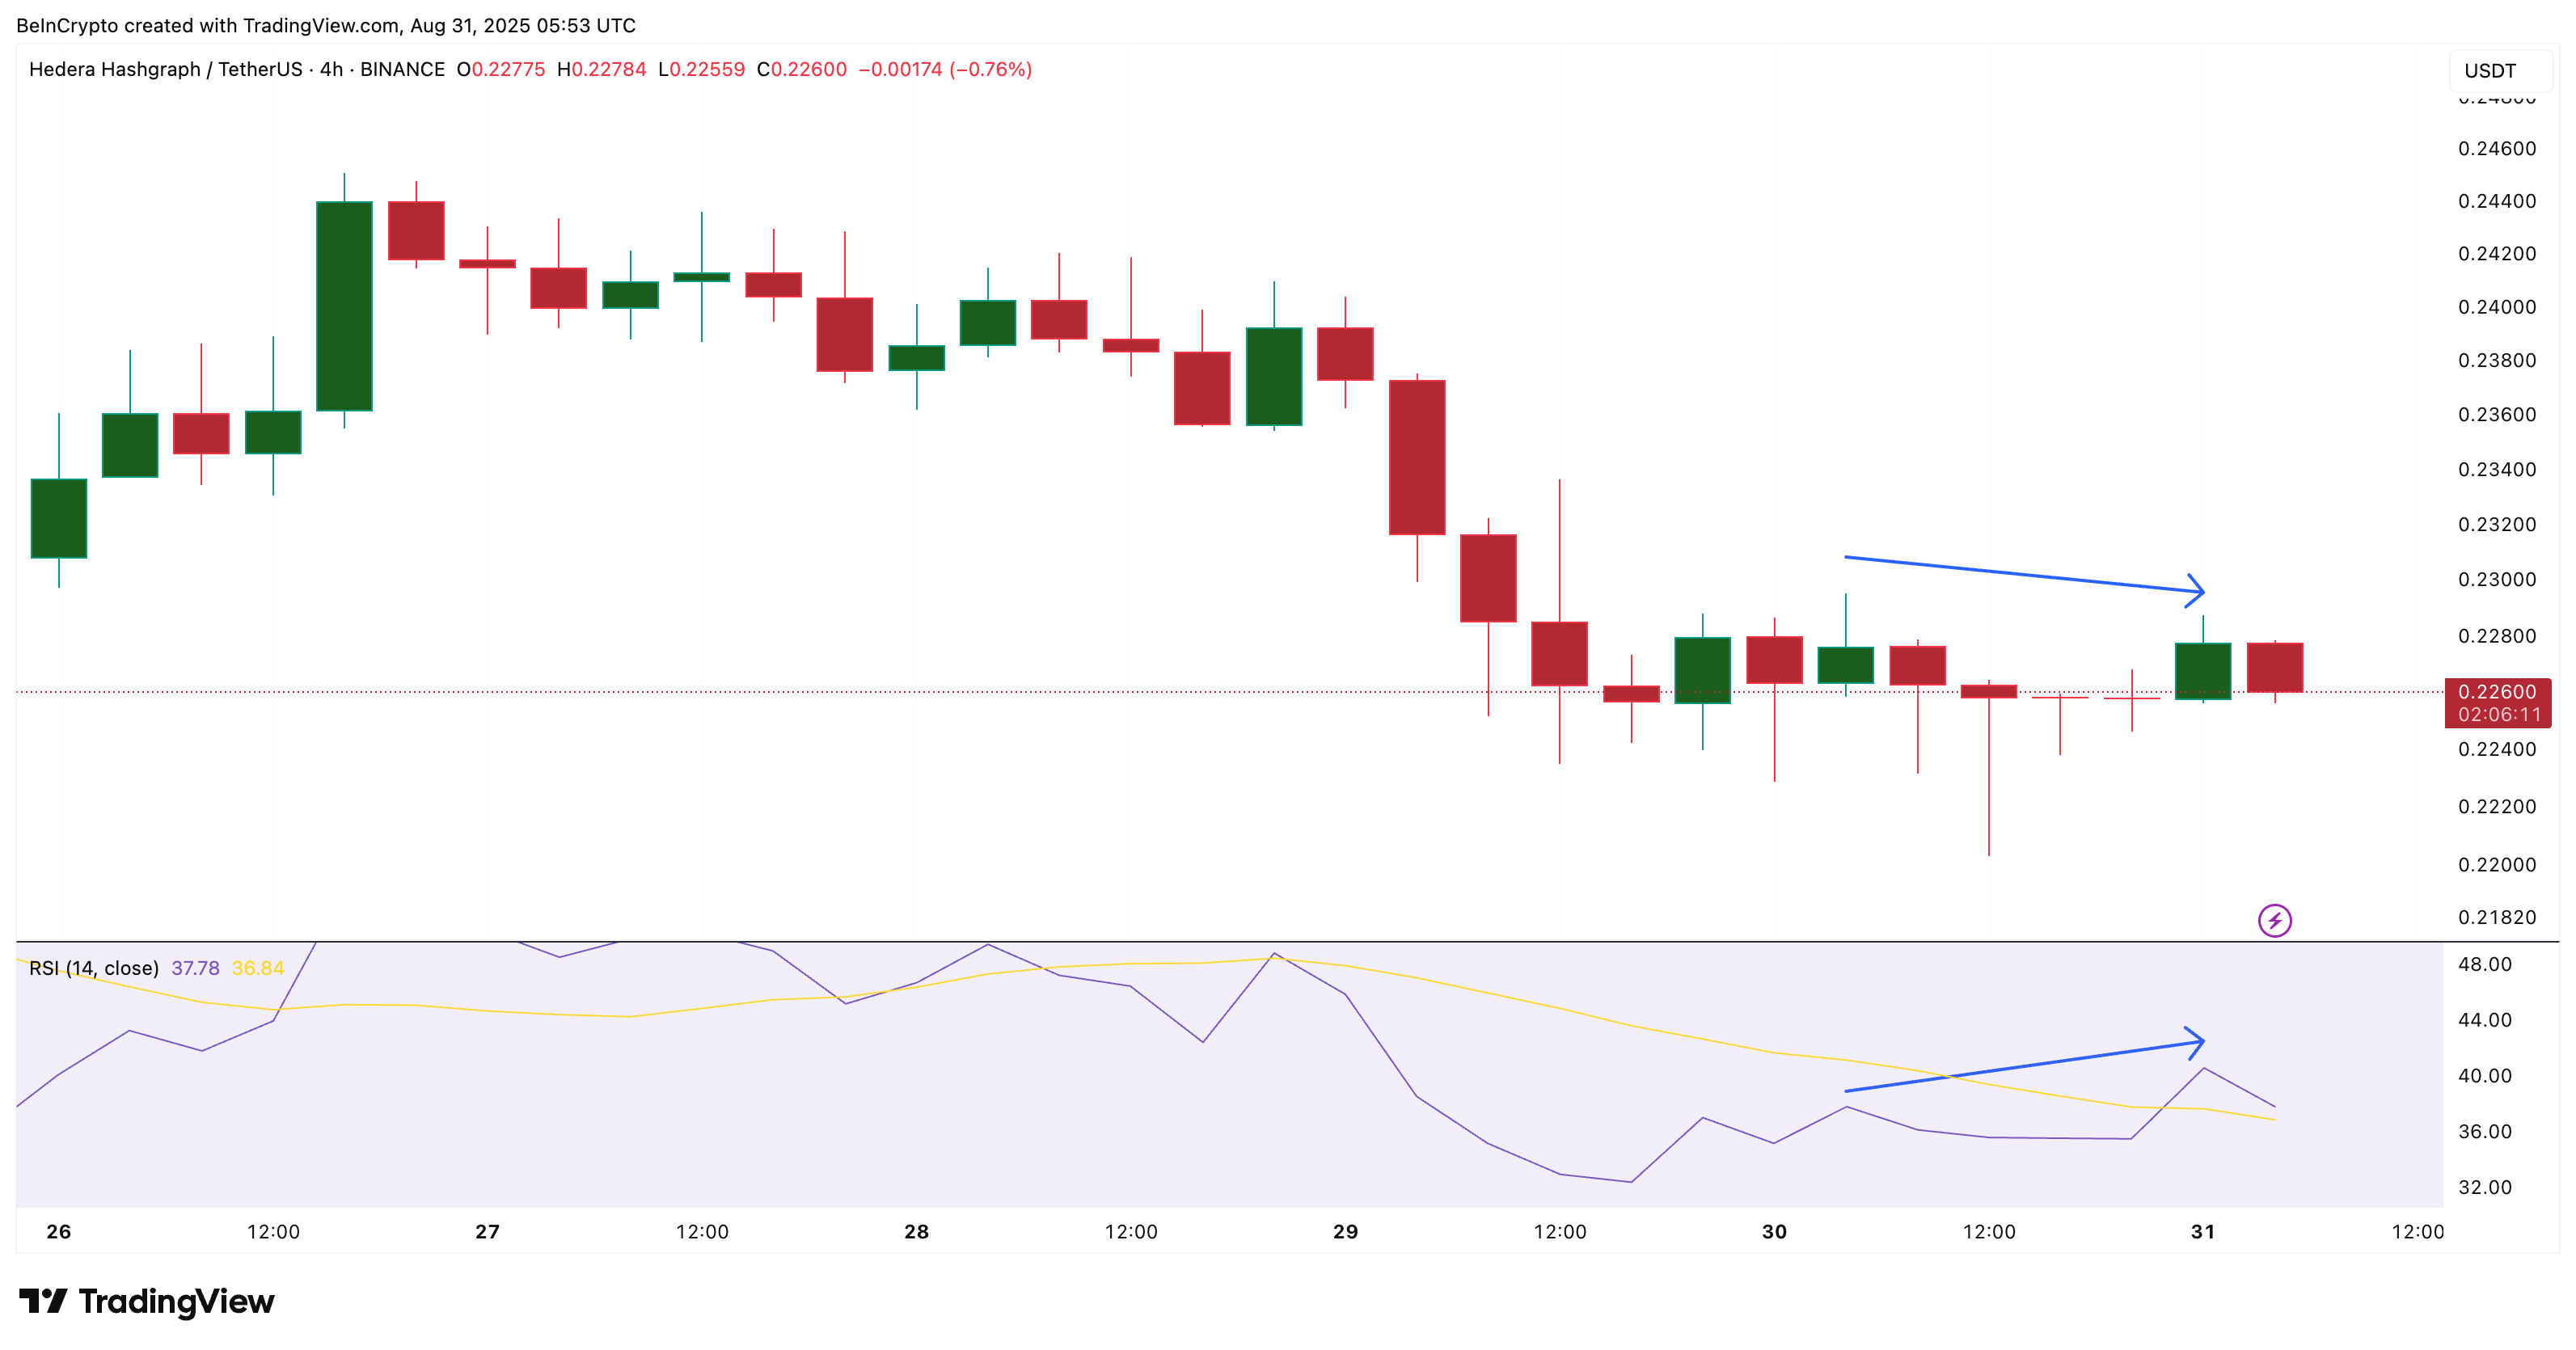
On the 4-hour chart, HBAR has demonstrated a hidden bearish divergence: while the price has formed lower highs, the RSI has shown higher highs. This pattern typically indicates that selling pressure continues to dominate, despite the outward appearance of stronger momentum.
This suggests that even with whales acquiring millions of tokens, the overarching trend still leans towards weakness, likely driven by selling activity from retail traders.
This divergence highlights the risk that HBAR’s price could keep declining, especially if retail selling persists against whale accumulation. It illustrates that while whales may be holding on to optimism following HBAR’s significant rally earlier this year, the short-term momentum remains precarious.
Hedera (HBAR) Price Levels Highlights Risk
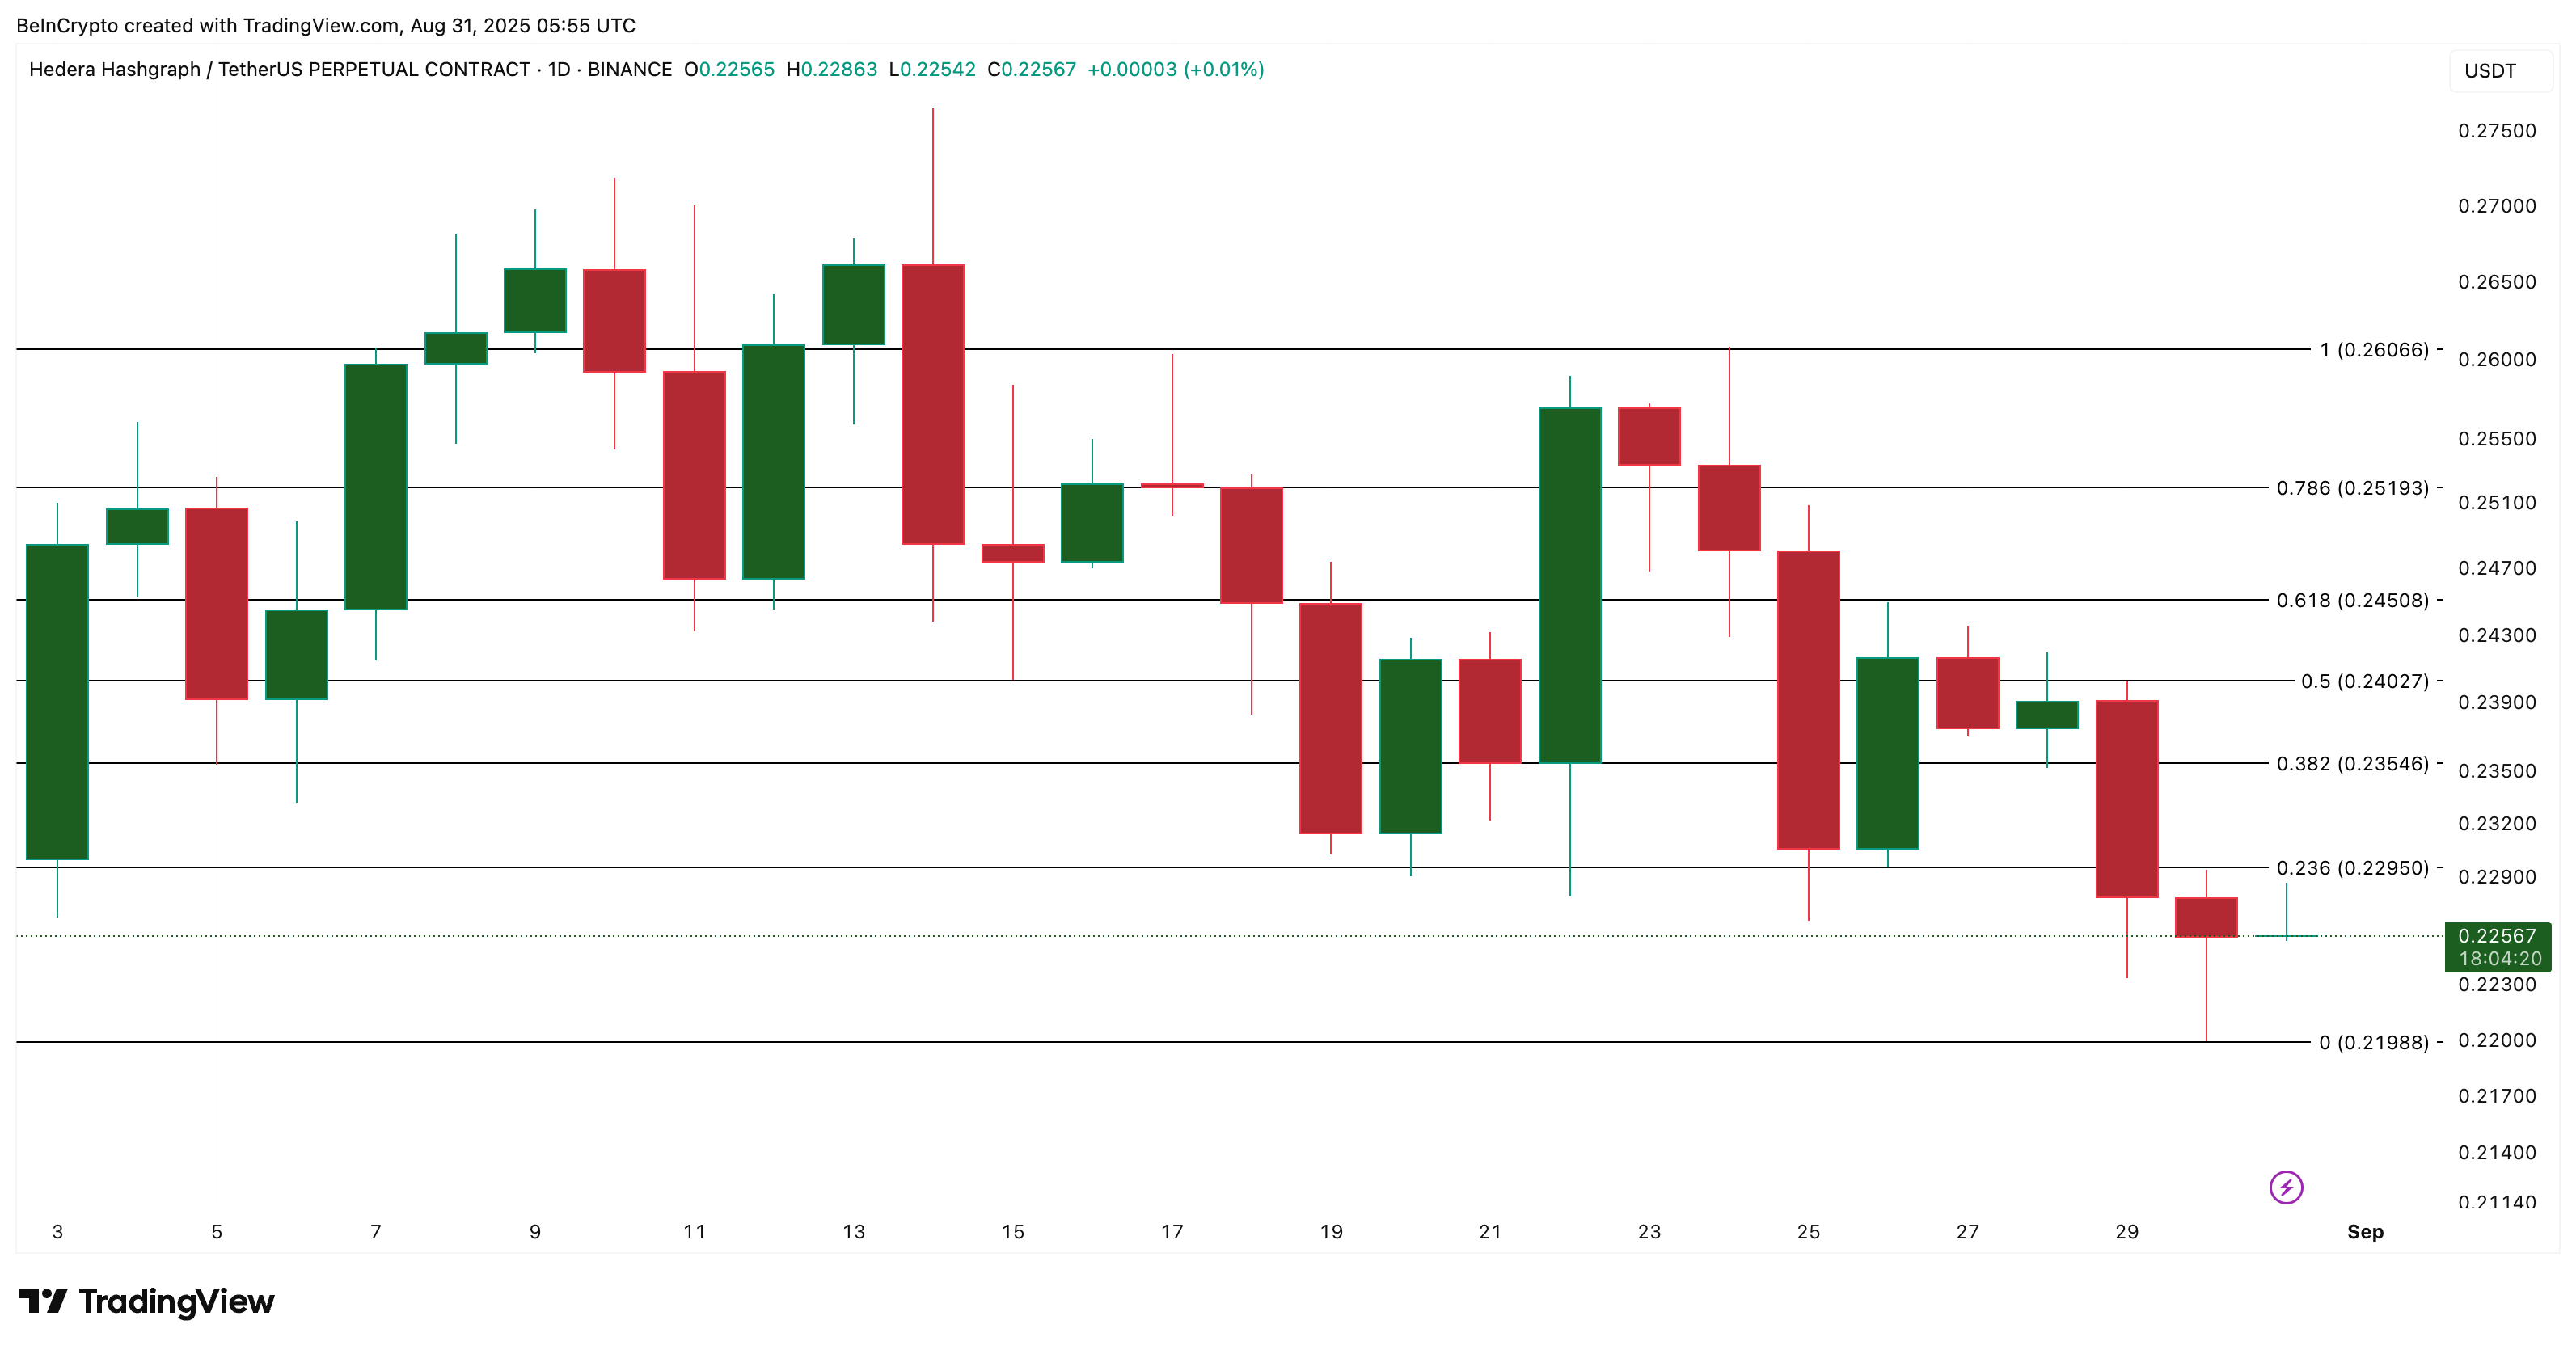
The daily HBAR price chart underscores the crucial levels that will determine HBAR’s course in the days ahead. The immediate support to monitor is at $0.219. A decisive daily close below this threshold would expose the price to further declines and validate the continuation of the month-long downtrend.

On the upside, reclaiming $0.240 would help to neutralize the bearish sentiment, while a sustained move above $0.260 would signify a complete trend reversal. Until those levels are surpassed, the broader structure remains at risk.
Disclaimer
In accordance with the Trust Project guidelines, this price analysis article is intended for informational purposes only and should not be viewed as financial or investment advice. BeInCrypto strives for accurate and impartial reporting, yet market conditions can change without warning. Always conduct your own research and seek professional advice before making any financial choices. Please be aware that our Terms and Conditions, Privacy Policy, and Disclaimers have undergone updates.

