The XRP price is currently at $2.83, experiencing a 2.67% drop in the last 24 hours, resulting in a weekly decline of around 7.5%. Despite this setback, Ripple’s token is still over 30% higher over the previous three months, indicating it remains in a broader uptrend.
Simultaneously, on-chain and technical indicators have started showing potential signs of a rebound. Whale activity, exchange flows, the taker buy-sell ratio, and momentum indicators all suggest a possible recovery, leading to the question: Does the XRP price prediction still allow for a rise above $3?
Exchange Inflow Value Bands Indicate Whale Patience
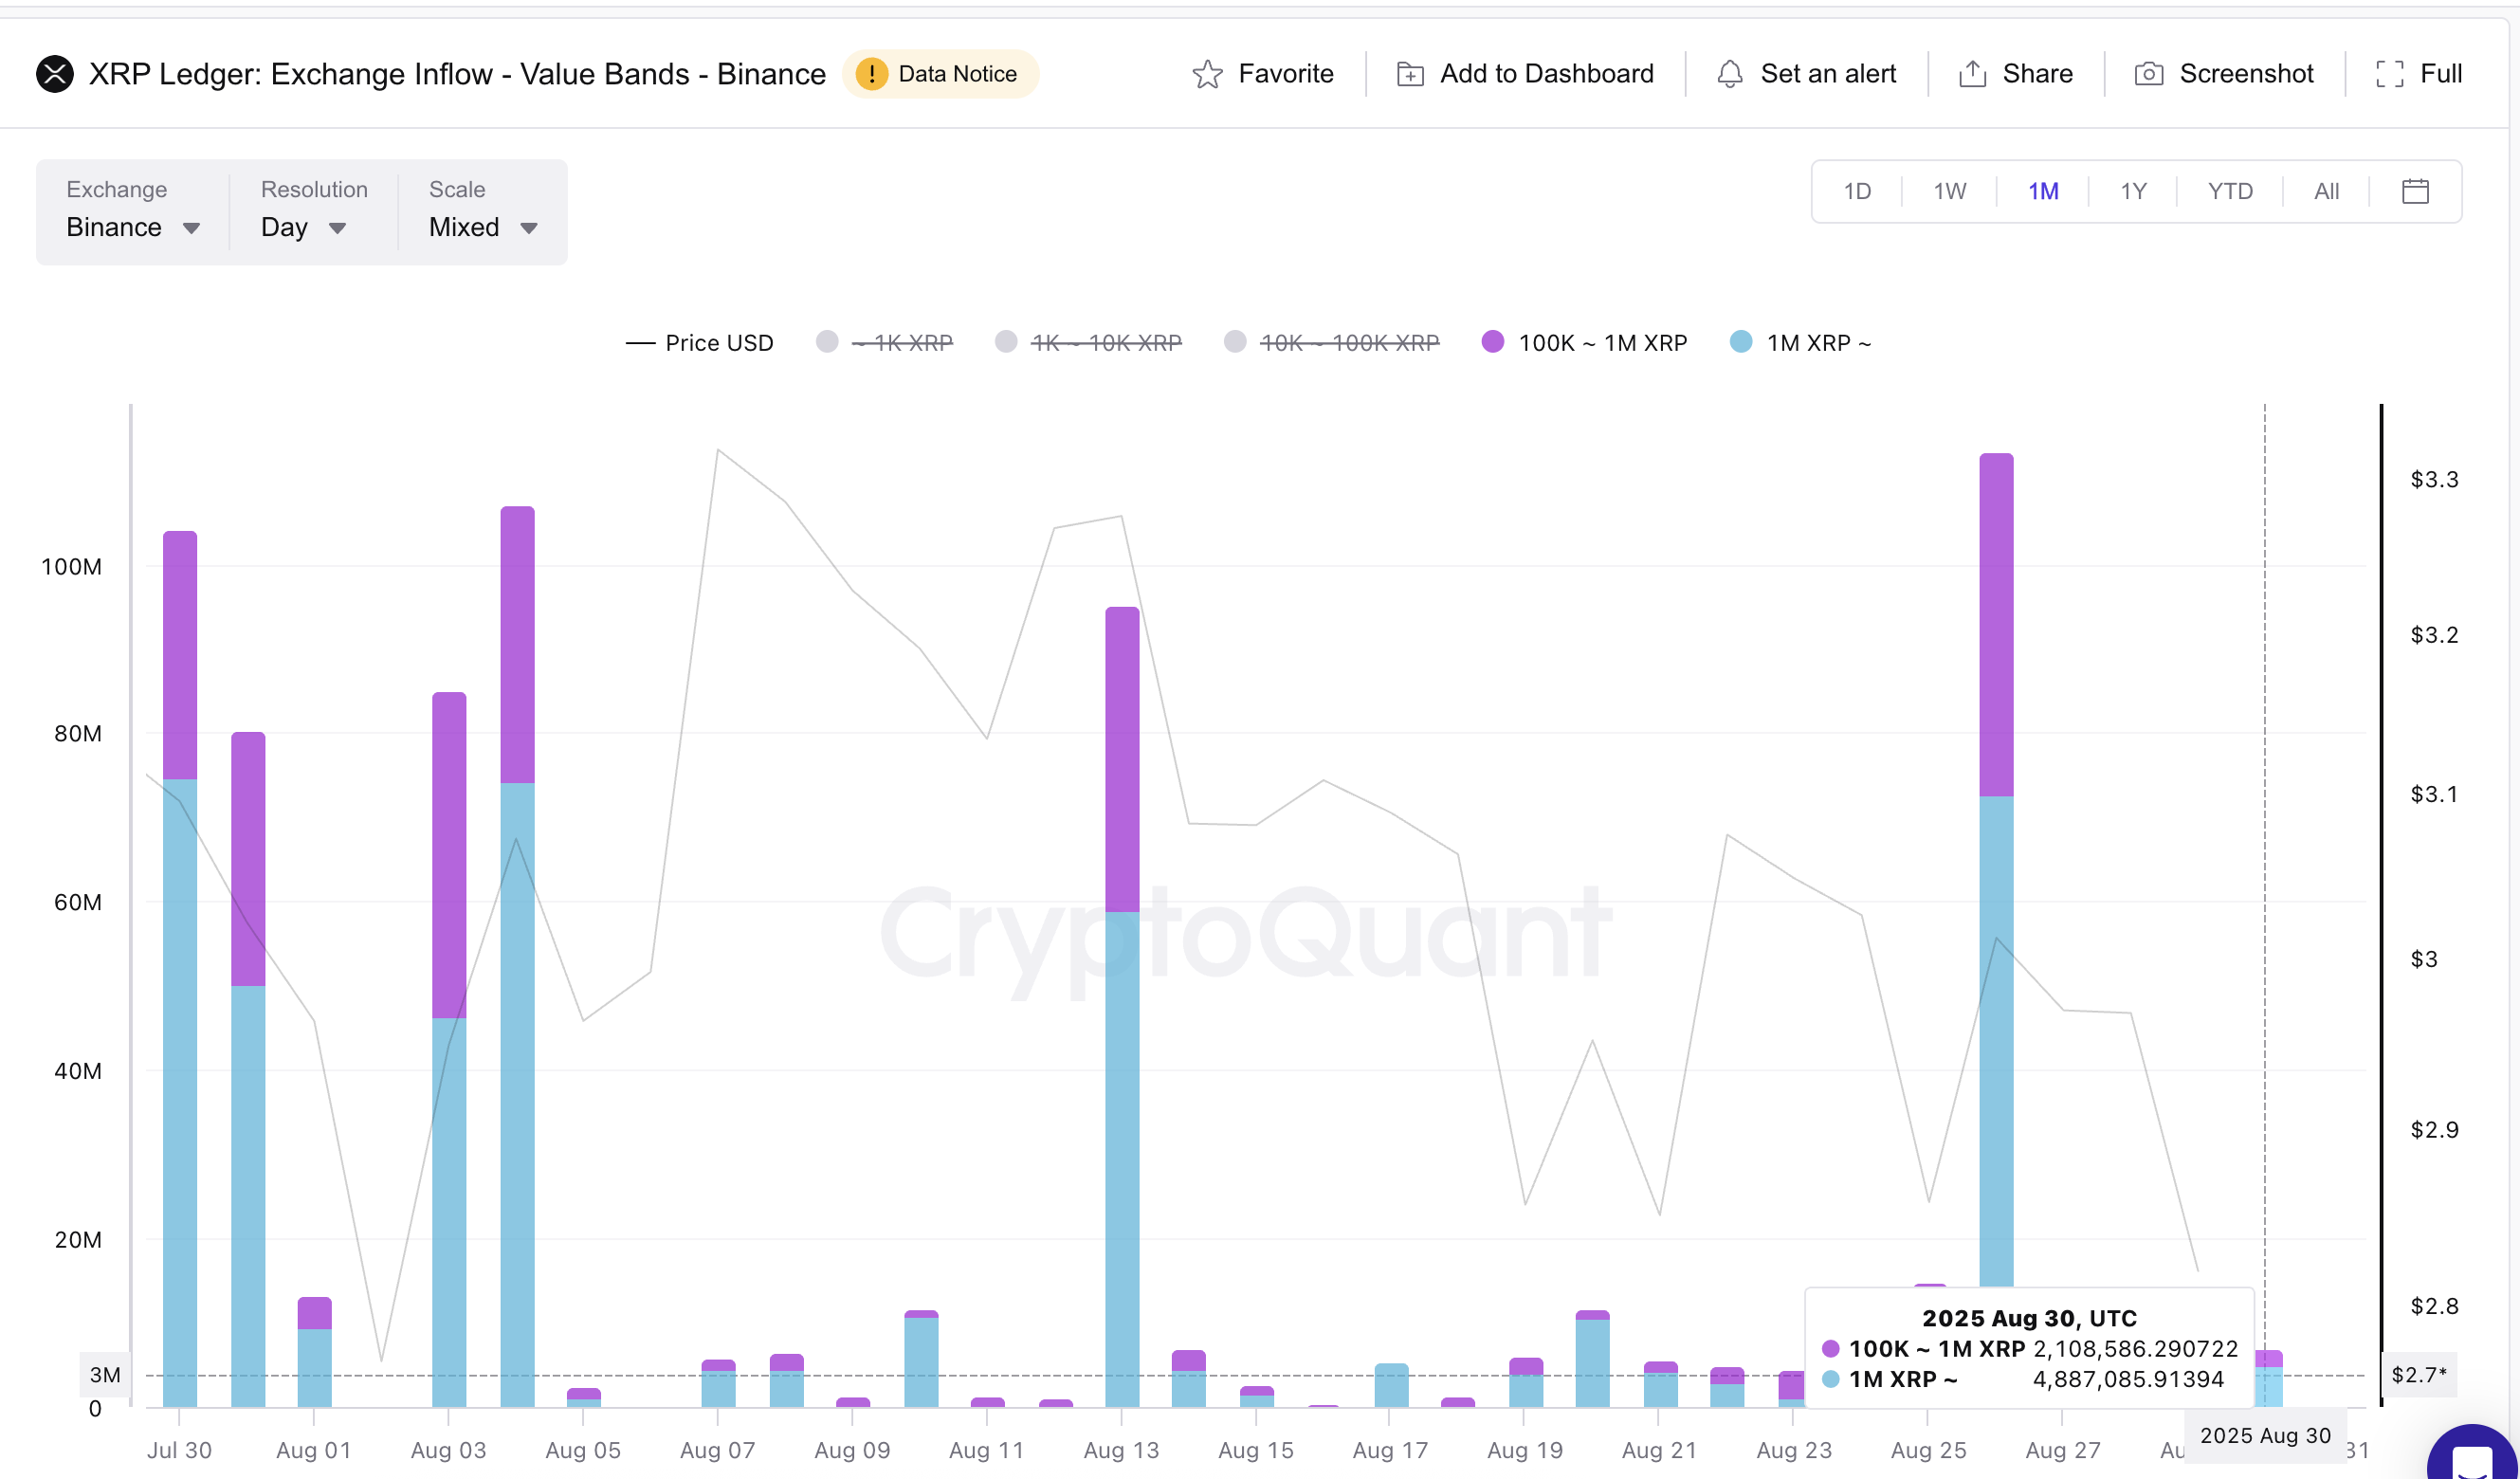
The initial indicator comes from exchange inflow value bands, which assess the amount of XRP of varying transaction sizes flowing into exchange wallets.
Significant inflow bands typically indicate that whales are preparing to sell, while a decrease signals they are holding off.
Since August 26, Binance’s large value band inflows have sharply decreased. Transactions valued between 100,000 and 1 million XRP have plummeted by nearly 95% from approximately 45.6 million XRP to just 2.1 million XRP by August 30. Inflows exceeding 1 million XRP fell by nearly 93% during the same timeframe.

This sharp decline suggests that whales are no longer transferring large volumes of XRP to exchanges, thus easing selling pressure.
Interested in more insights on tokens like this? Sign up for Editor Harsh Notariya’s Daily Crypto Newsletter here.
With whales demonstrating patience, the foundational support for the XRP price strengthens. This implies that while retail traders may quickly sell during pullbacks, large holders are remaining on the sidelines, which is often an indication that a rebound could be imminent.
Taker Buy-Sell Ratio Suggests Market Bottom
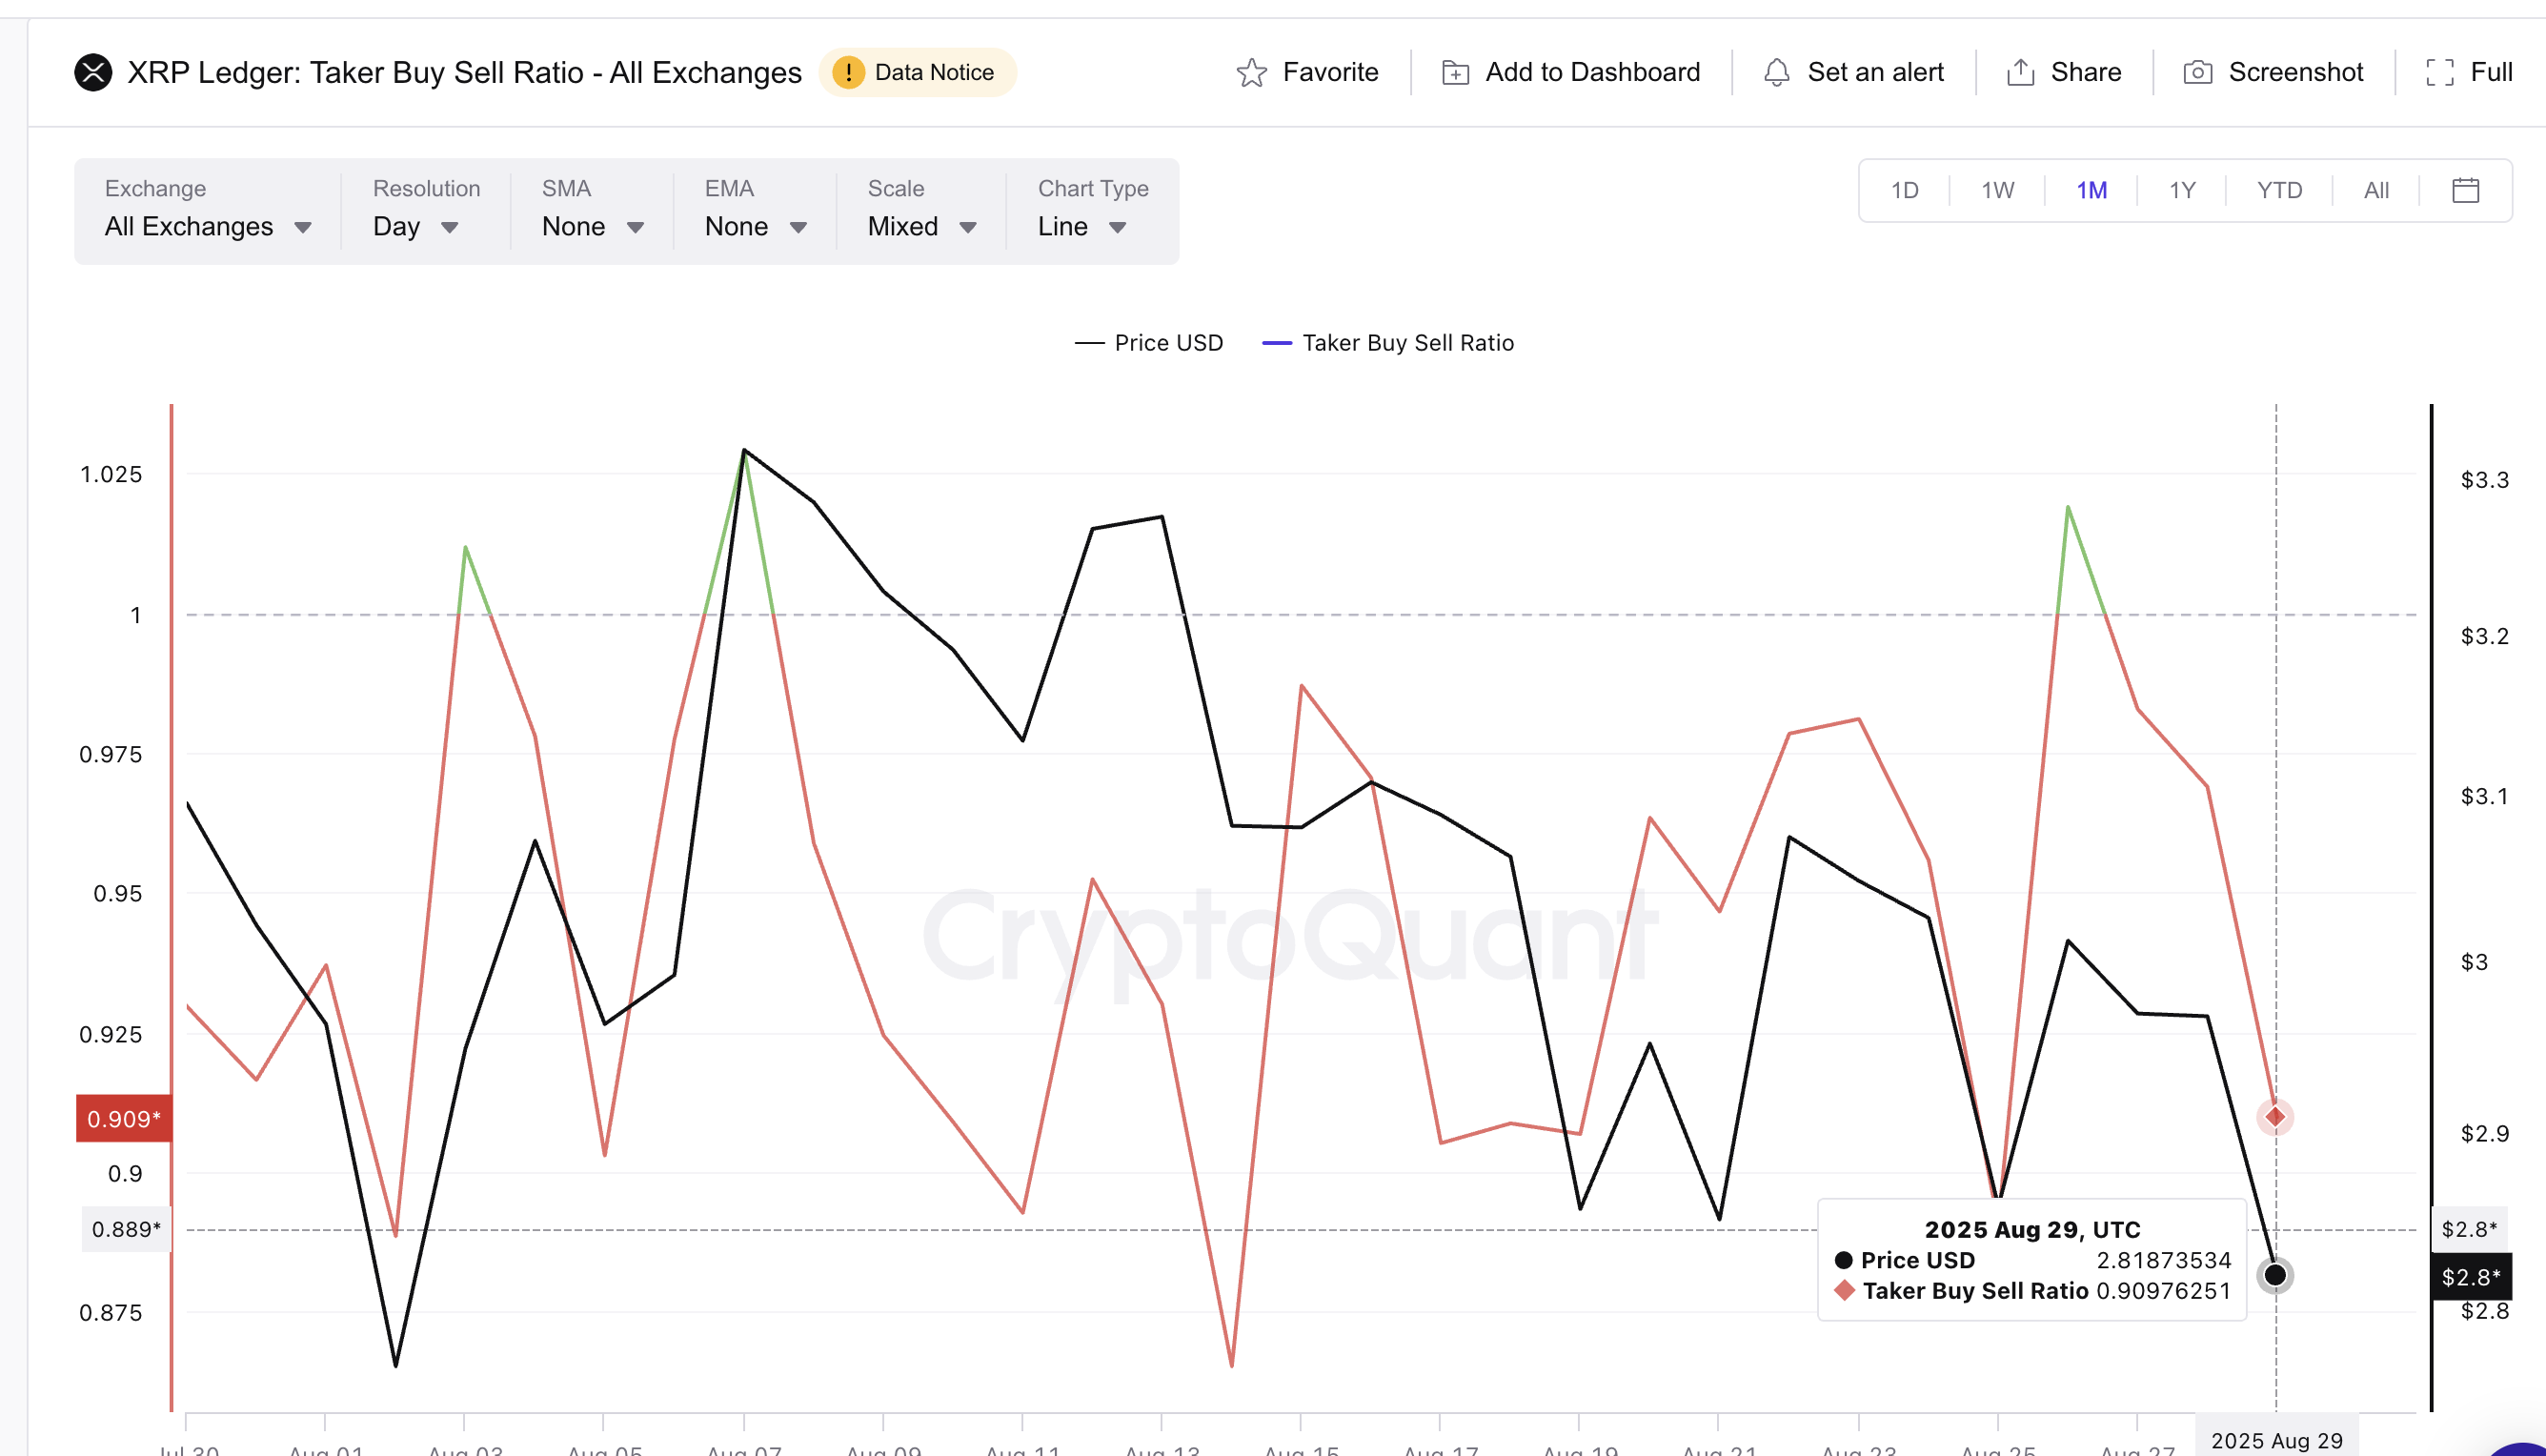
In addition to whale behavior, the Taker buy-sell ratio offers another significant signal. This ratio measures whether market takers are more aggressive in their buying or selling actions. A reading above one indicates robust buying activity, while below one depicts stronger selling.
As of now, the ratio is at 0.90, reflecting increased selling pressure. At first glance, this appears bearish, specifically since retail traders often dominate this metric by selling quickly and not negotiating on price. With whales reducing their activity, it seems that the low ratio is largely driven by retail sellers.

However, reviewing August shows that nearly every instance when the taker buy-sell ratio dropped below one corresponded with a local market bottom.
On August 2, the ratio fell to 0.88, and the XRP price surged nearly 20% in the ensuing weeks. Another drop on August 19 marked a local bottom prior to a rally. The current reading is now approaching those levels.
This indicates that what may seem like bearish retail sentiment could actually be paving the way for another rebound.
When combined with whales curbing their exchange inflows, the taker buy-sell ratio supports the overarching narrative: while retail may be selling, whales seem confident, and historically, this divergence has laid the groundwork for upward movements.
XRP Price Prediction And RSI Levels To Monitor
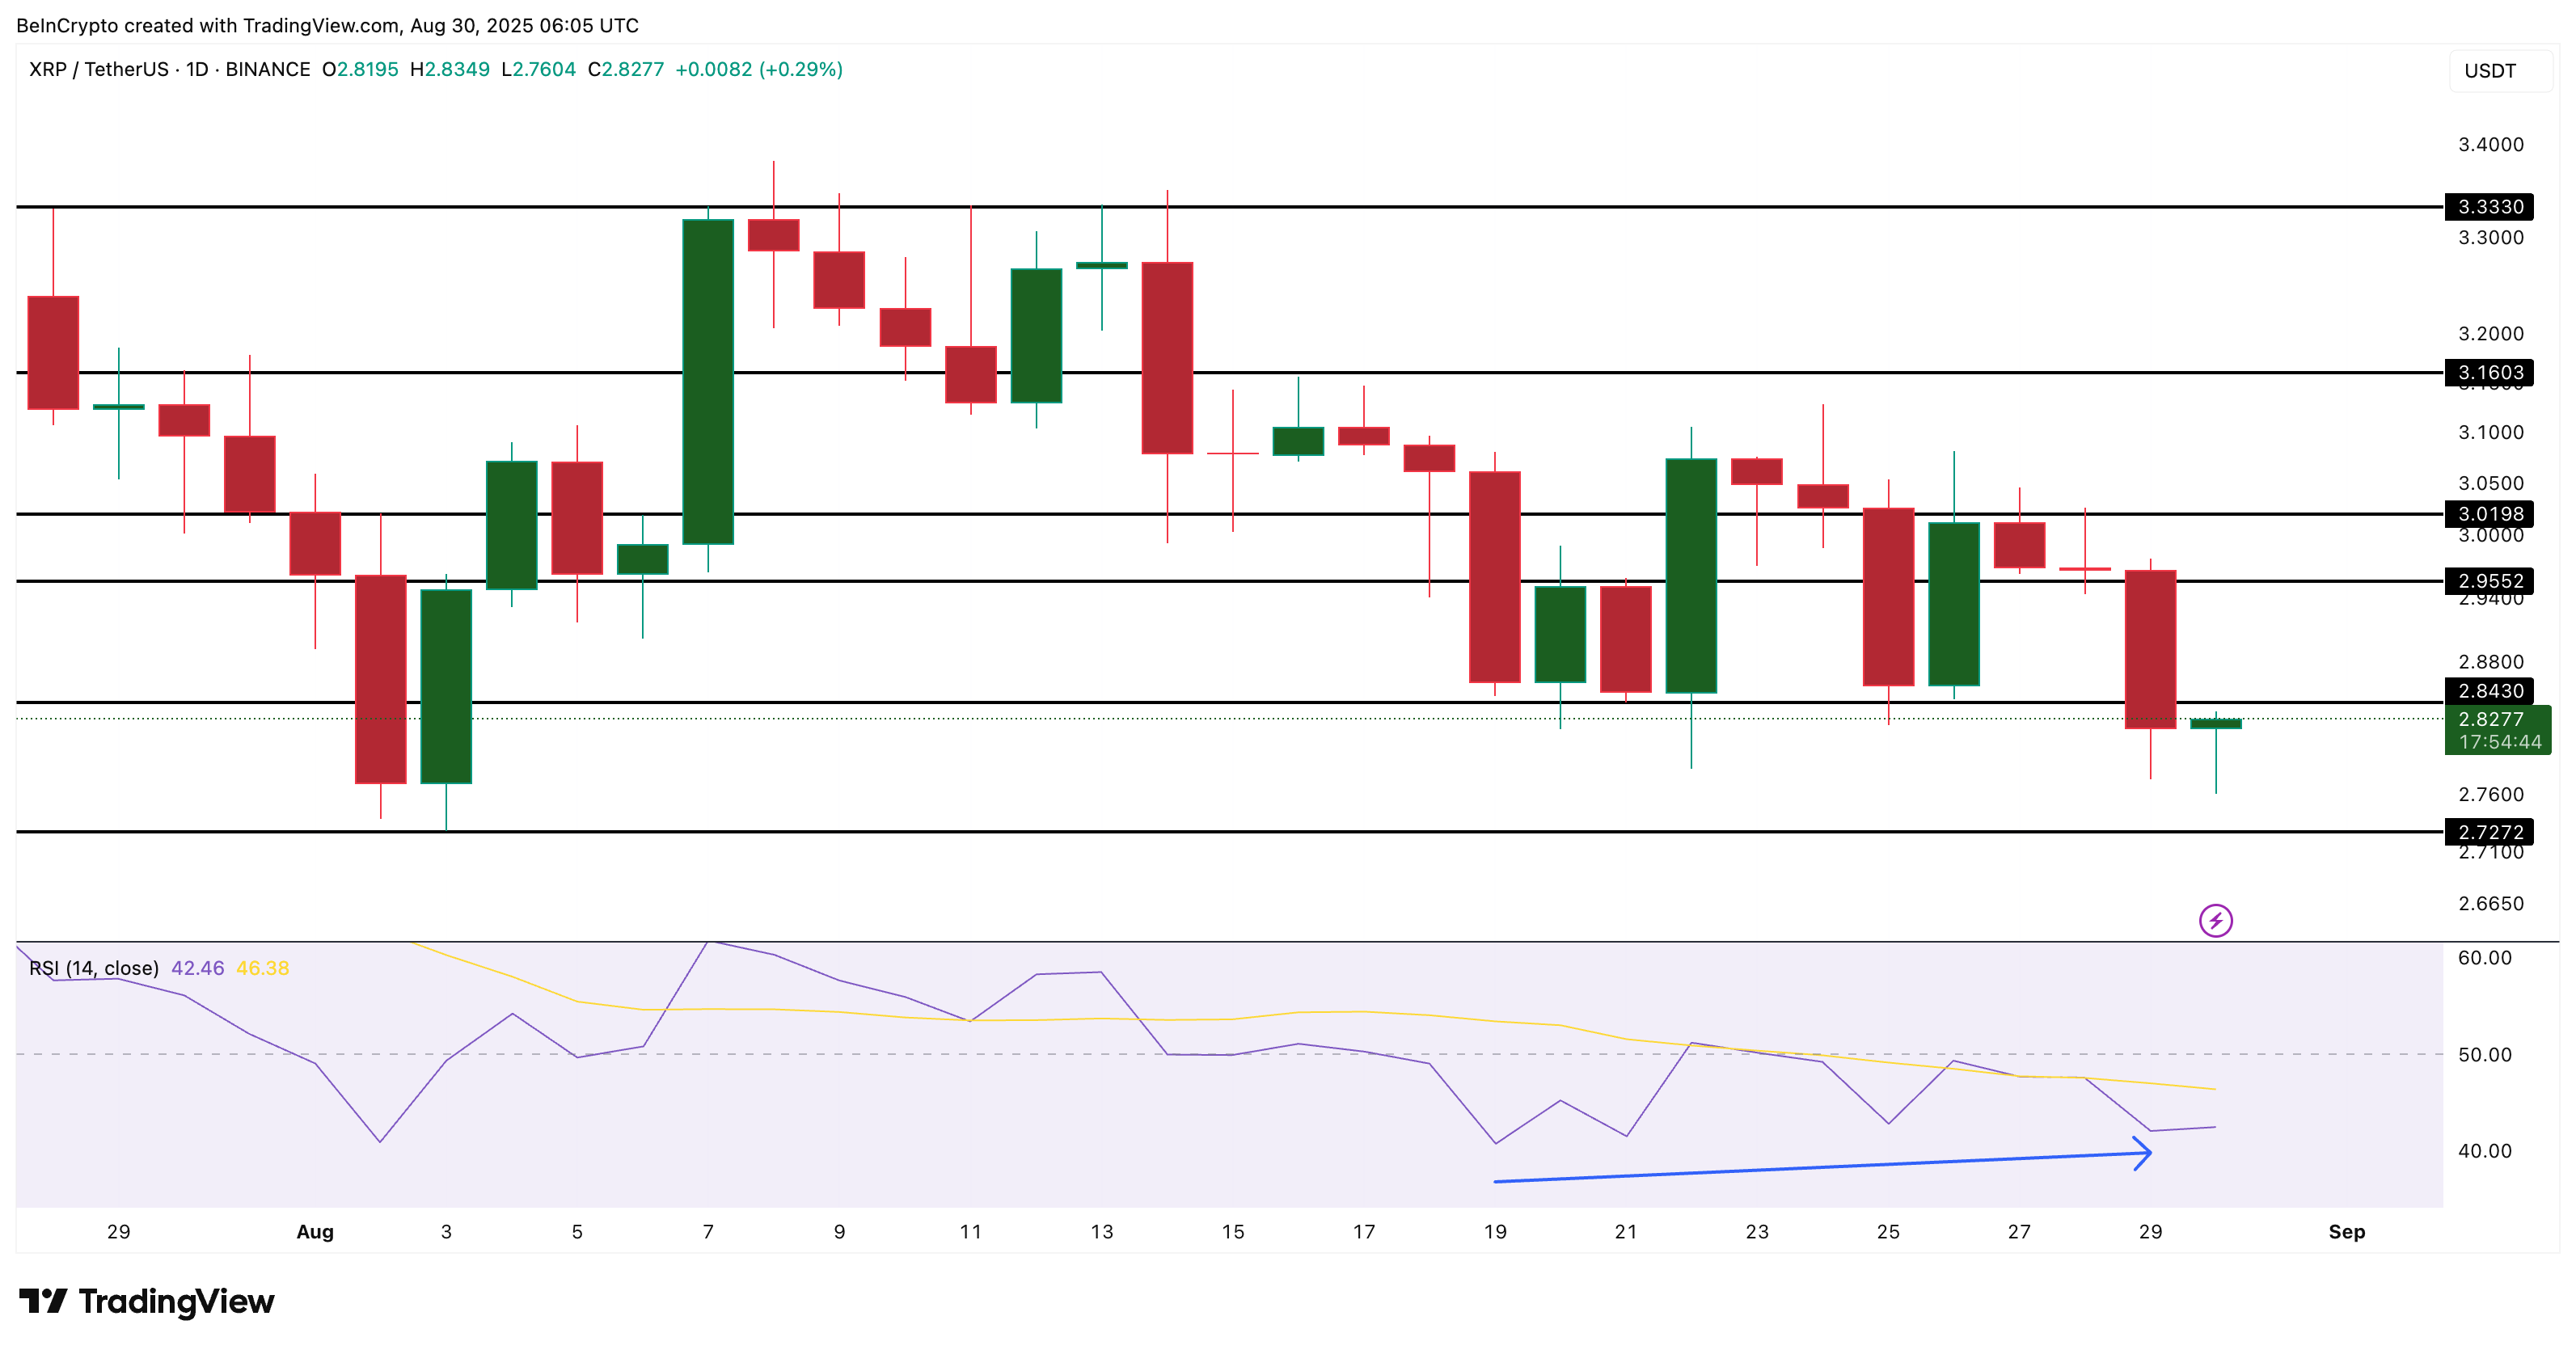
The technical chart offers additional insight. The relative strength index (RSI) has diverged from the price action, signaling a bullish indication.
While the XRP price established a lower low between August 19 and August 29, the RSI registered a higher low during that timeframe. This bullish divergence indicates diminishing downside momentum and strengthens the argument for a rebound.
The Relative Strength Index (RSI) gauges momentum by monitoring the pace and magnitude of recent price fluctuations.

For the XRP price target, the first crucial level to observe is $2.84. A daily candle close above this level could catalyze a movement towards $2.95, followed by the psychological threshold of $3.00. A decisive break beyond $3.33 would turn the trend bullish and confirm a broader XRP price forecast for further upside.
However, the bullish outlook is nullified if XRP closes below $2.72 on the daily chart. Such a breakdown would indicate that retail-driven selling pressure has eclipsed whale support, shifting momentum back to bearish territory.
Disclaimer
In line with the Trust Project guidelines, this price analysis article is for informational purposes only and should not be considered financial or investment advice. BeInCrypto is committed to accurate, unbiased reporting, but market conditions are subject to change without notice. Always conduct your own research and consult with a professional before making any financial decisions. Please note that our Terms and Conditions, Privacy Policy, and Disclaimers have been updated.

