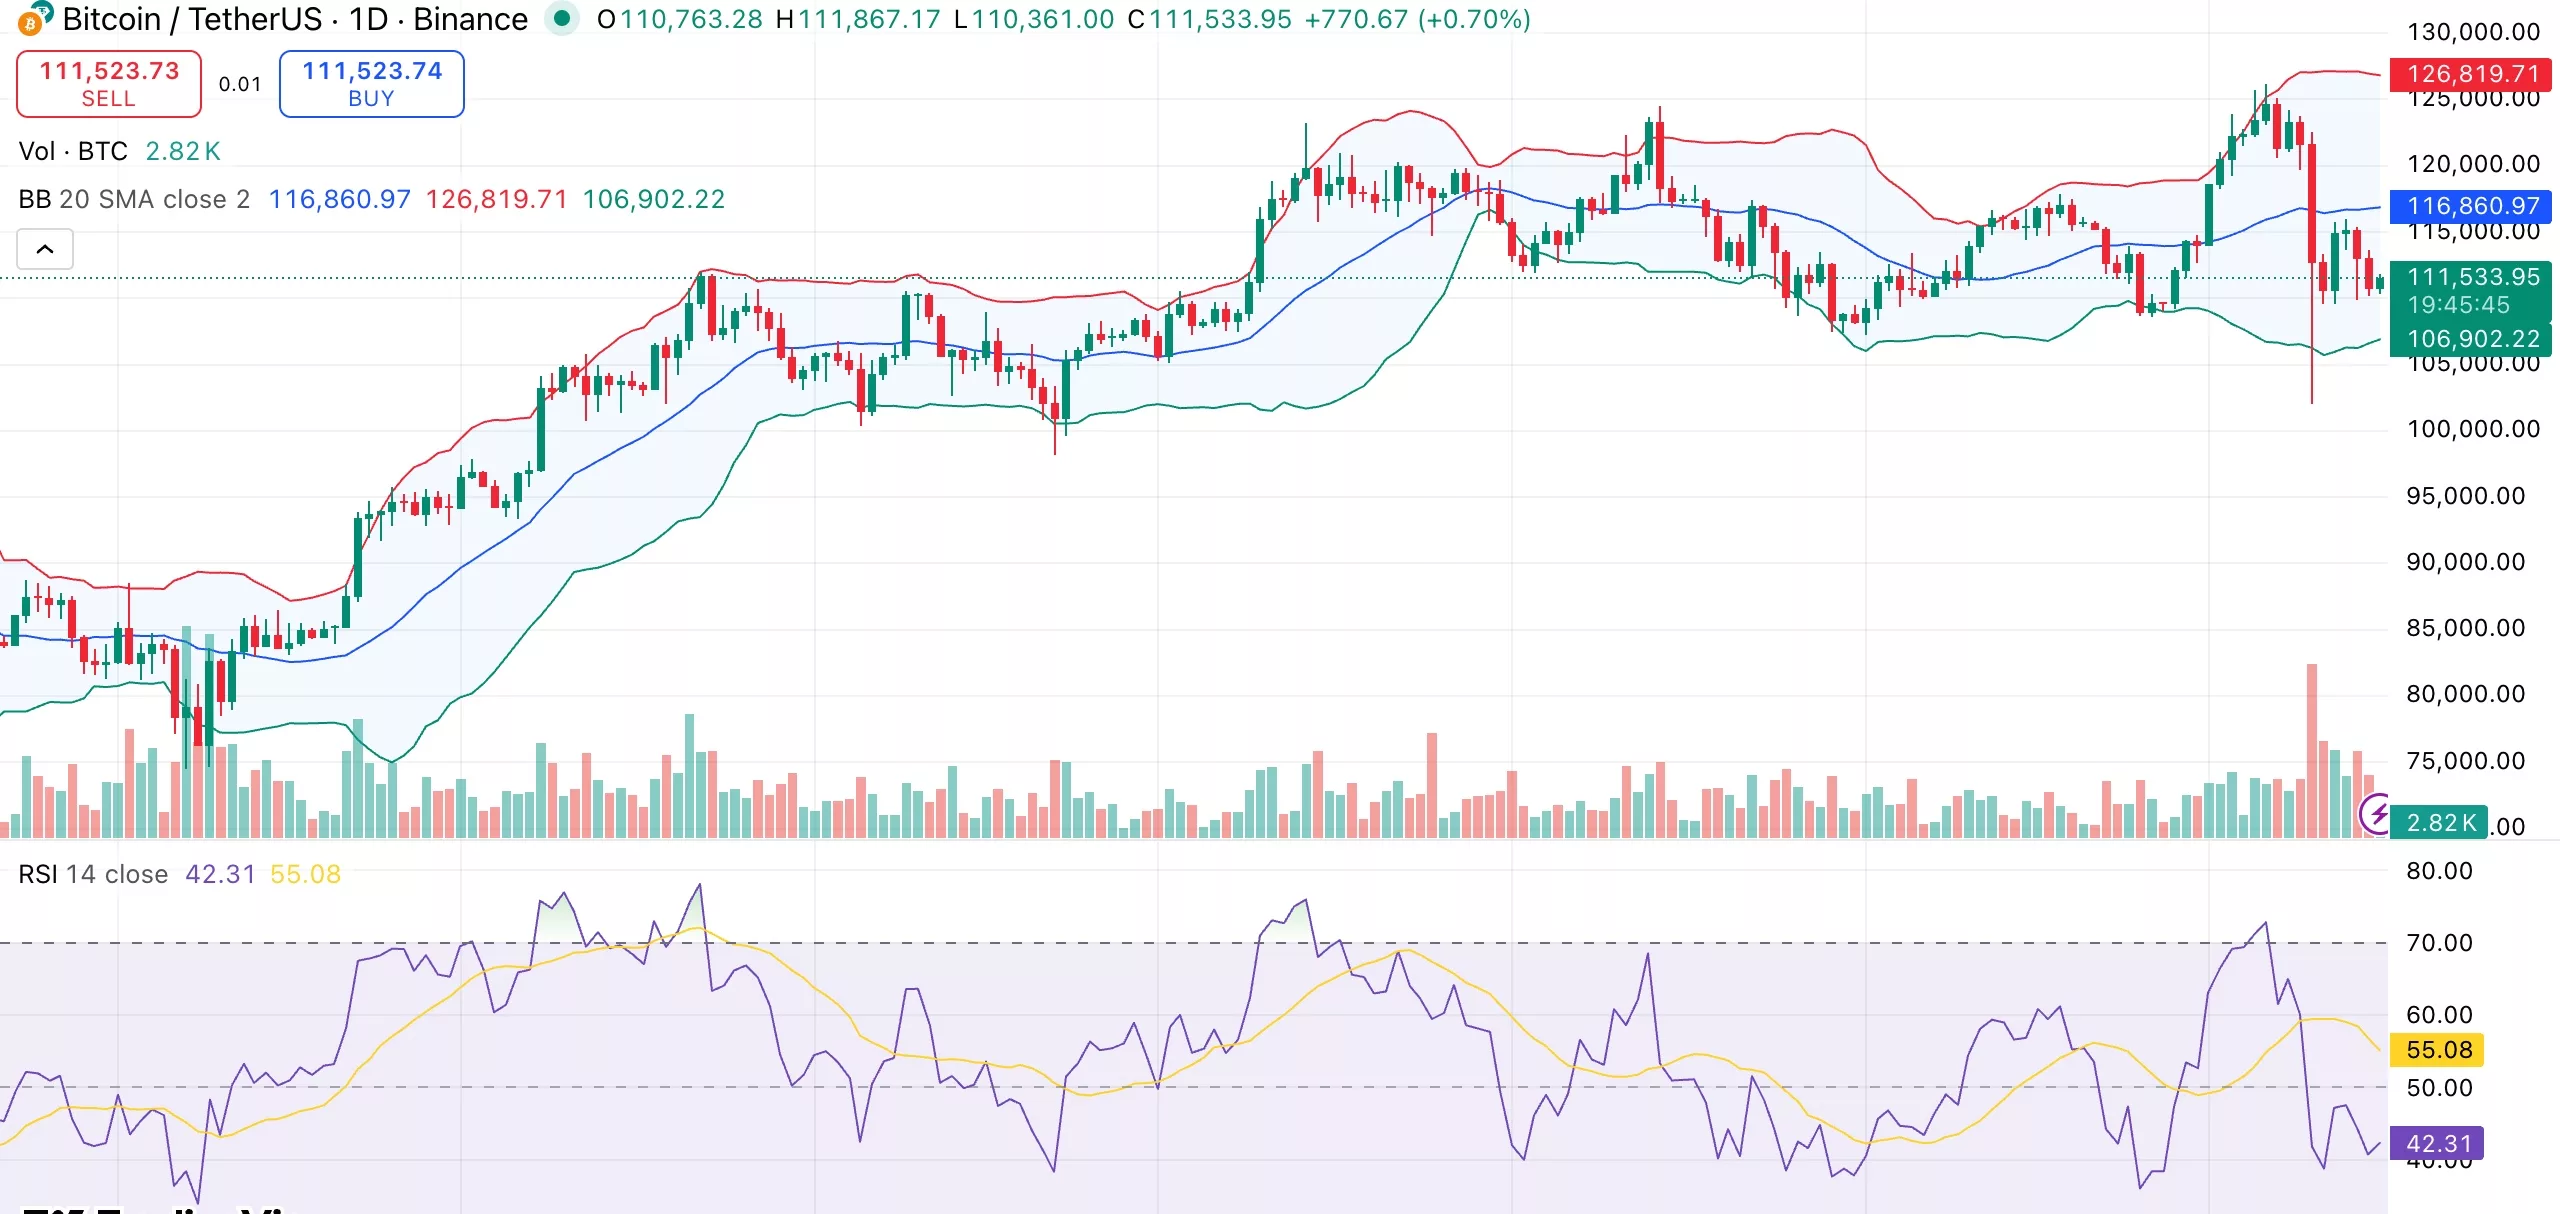
On October 16, Bitcoin’s price decreased, testing crucial support around $111,000 as spot Bitcoin exchange-traded funds (ETFs) experienced a return to net outflows after a brief period of inflows.
Summary
- Bitcoin trades near $111K as BTC spot ETFs report $94M in outflows.
- Trading volume and derivatives show a cautious market mood.
- Dovish statements from the Fed raise hopes for potential upside movement.
At the time of writing, Bitcoin was priced around $111,673, reflecting an 8% decrease over the past week and a 0.5% drop over the previous day. Trading volume has sharply declined to $66.2 billion, more than a 27% drop in just one day, indicating thinning market participation.
According to CoinGlass data, Bitcoin (BTC) open interest saw a slight decrease to $72 billion, while derivatives volume fell by 35.5% to $92.5 billion. This suggests traders may be closing leveraged positions and waiting for clearer indicators before re-entering the market.
Spot BTC ETF Outflows Indicate Renewed Caution
As reported by SoSoValue data, U.S. spot Bitcoin ETFs experienced $94 million in net outflows on October 15, primarily driven by Grayscale’s GBTC, which saw $82.9 million withdrawn. Invesco and BlackRock also reported smaller outflows.
After nine consecutive sessions of inflows, ETFs encountered their first significant redemptions on October 13. This latest shift occurred following net inflows of $102.6 million on October 14, suggesting institutional interest remains cautious.
BTC Options Market Turns Bearish
Data from Greeks.live indicates a significant increase in short-term bearish activity within the Bitcoin options market. Put options accounted for 28% of all trading volume, with strike prices between $104,000 and $108,000.
This trend reflects temporary caution rather than a fundamental shift to bearish sentiment, given that longer-term indicators remain neutral and traders are hedging against short-term risks.
In the medium term, macroeconomic conditions remain favorable. Fed Chair Jerome Powell’s comments on October 14 heightened expectations for a potential rate cut at the month’s end. Reduced rates could enhance liquidity and benefit risk assets like Bitcoin.
However, escalating trade tensions between the U.S. and China, along with increased tariffs, pose significant challenges, keeping risk sentiment fragile.
Technical Analysis of Bitcoin Price
Currently, Bitcoin is trading within the lower Bollinger Band on the daily chart, consolidating near its short-term support level between $110,000 and $111,000. The relative strength index (RSI) stands at 42, indicating neutral momentum but edging closer to oversold territory.

The stochastic oscillator reading of 13 suggests the market has cooled quickly and may be on the verge of a short-term upside reversal if buying pressure returns.
The absence of buyer interest following October’s rally to $126,000 is reflected in the negative momentum and MACD readings. Nonetheless, the long-term structure remains sound. The simple and exponential 200-day moving averages are positioned around $107,000, providing a crucial safety net for bulls.
A rebound from this range could target resistance levels around $114,000–$116,000, where the mid-Bollinger Band currently lies. Conversely, a decline below $110,000 may expose Bitcoin to a more significant drop, potentially down to $104,000.

