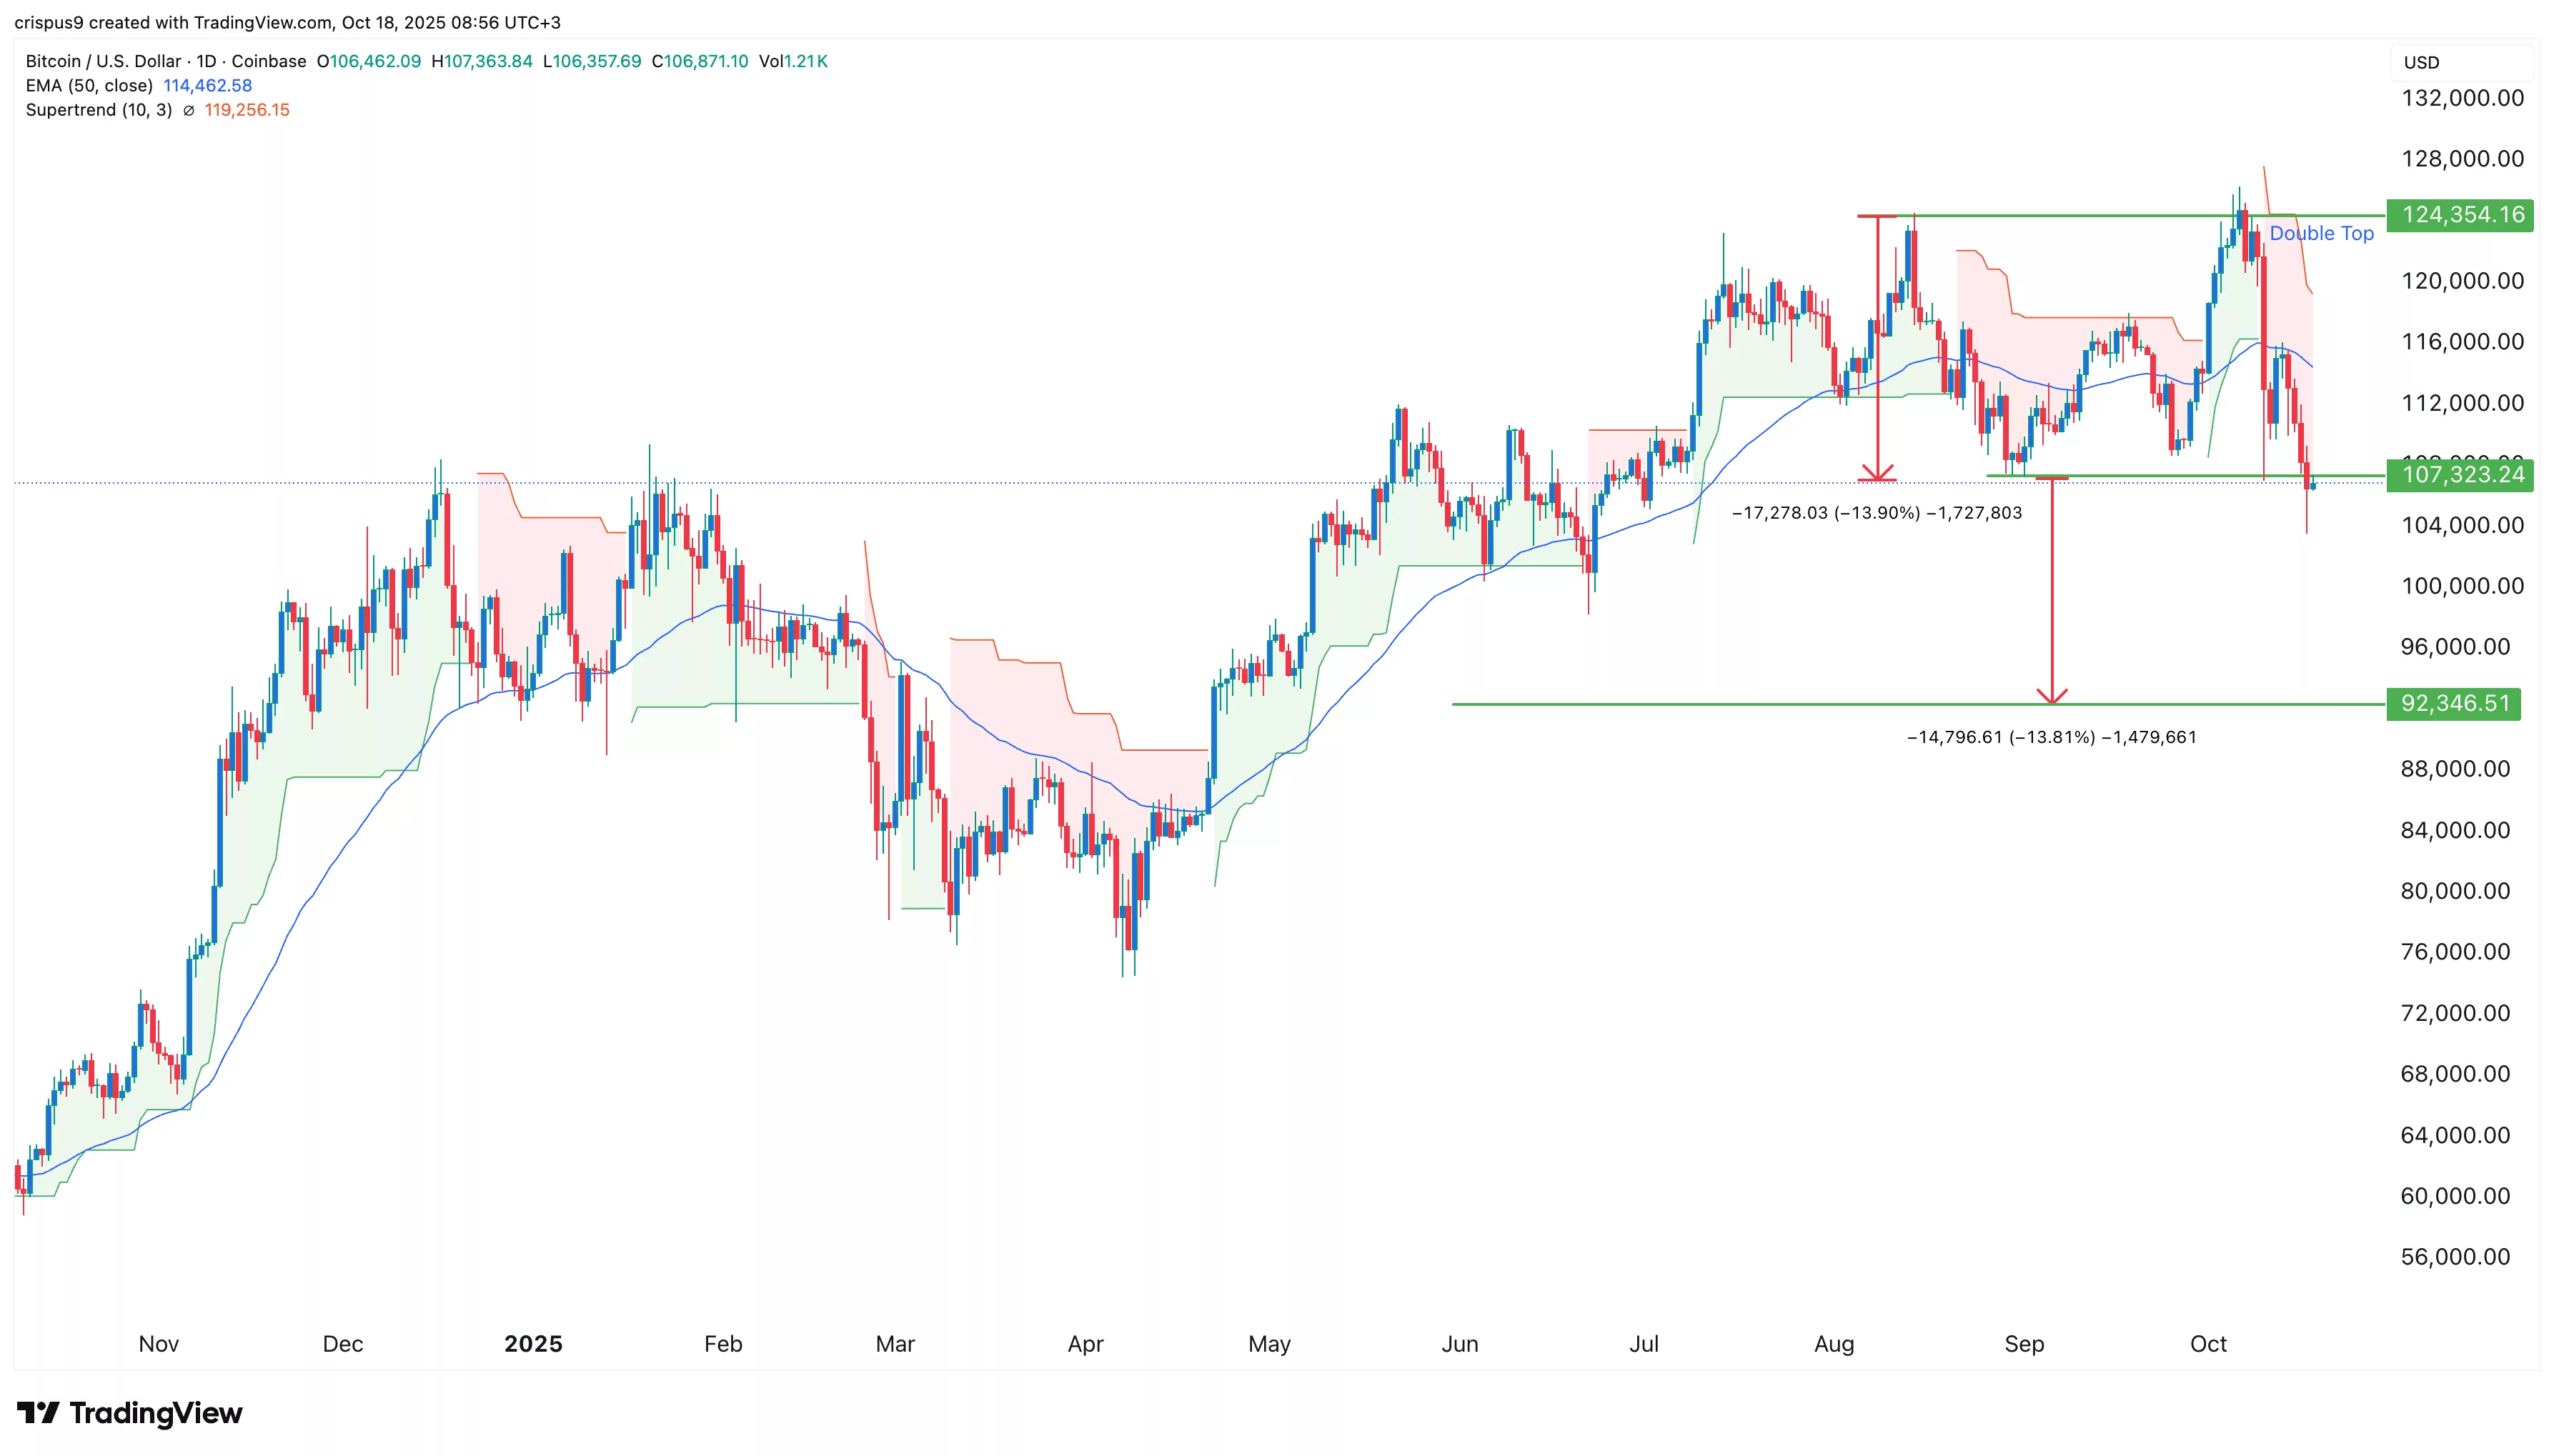
The price of Bitcoin has entered a correction phase, declining by 14% from its peak this year. This downward trend could persist as risky patterns emerge and outflows from exchange-traded funds (ETFs) continue.
Summary
- A double-top pattern has formed in the daily chart for Bitcoin.
- This week, spot Bitcoin ETFs experienced a loss of over $1.6 billion in assets.
- Investors are facing considerable anxiety due to recent liquidations.
American investors sold off their Bitcoin (BTC) holdings this week as the crypto Fear and Greed Index dropped into the fear territory and liquidations surged.
Data from SoSoValue indicates that spot Bitcoin ETFs lost over $1.23 billion in assets this week. BlackRock’s IBIT accounted for more than $268 million in losses, while Fidelity’s FBTC also saw declines.
These outflows have brought the total inflows since their launch in January of last year to $61.54 billion.
The recent outflows mark a stark contrast to the previous two weeks, during which nearly $6 billion had been added in assets.
Investors sold off Bitcoin after liquidations exceeding $4.65 billion occurred last Friday, coinciding with a significant market crash. It’s common for investors to offload their holdings or adopt a wait-and-see approach following such substantial liquidation events.

Additionally, investors have leaned towards selling Bitcoin as gold is seen as a more reliable safe-haven asset amid escalating risks. Concerns are growing regarding a potential trade war between the U.S. and China, which might lead to increased inflation, potentially hindering the Fed’s ability to lower interest rates.
Other significant risks include the ongoing U.S. government shutdown and issues surrounding credit quality. Recent fraud-related losses reported by three regional banks have brought credit concerns to the forefront.
Bitcoin price technical analysis

The daily chart indicates that BTC price remains under considerable pressure, having dropped 14% from its peak this year.
It has fallen below the 50-day moving average, and the Supertrend indicator is now red. Notably, a double-top pattern has materialized at $124,355.
A double top is a prevalent bearish indicator in technical analysis. The profit target is determined by measuring the distance between the peak and the neckline, then applying the same measurement downwards from the neckline.
In this scenario, the profit target is approximately $92,345, marking its lowest level since April of this year. A movement above the resistance level at $113,000 would negate the bearish outlook.

