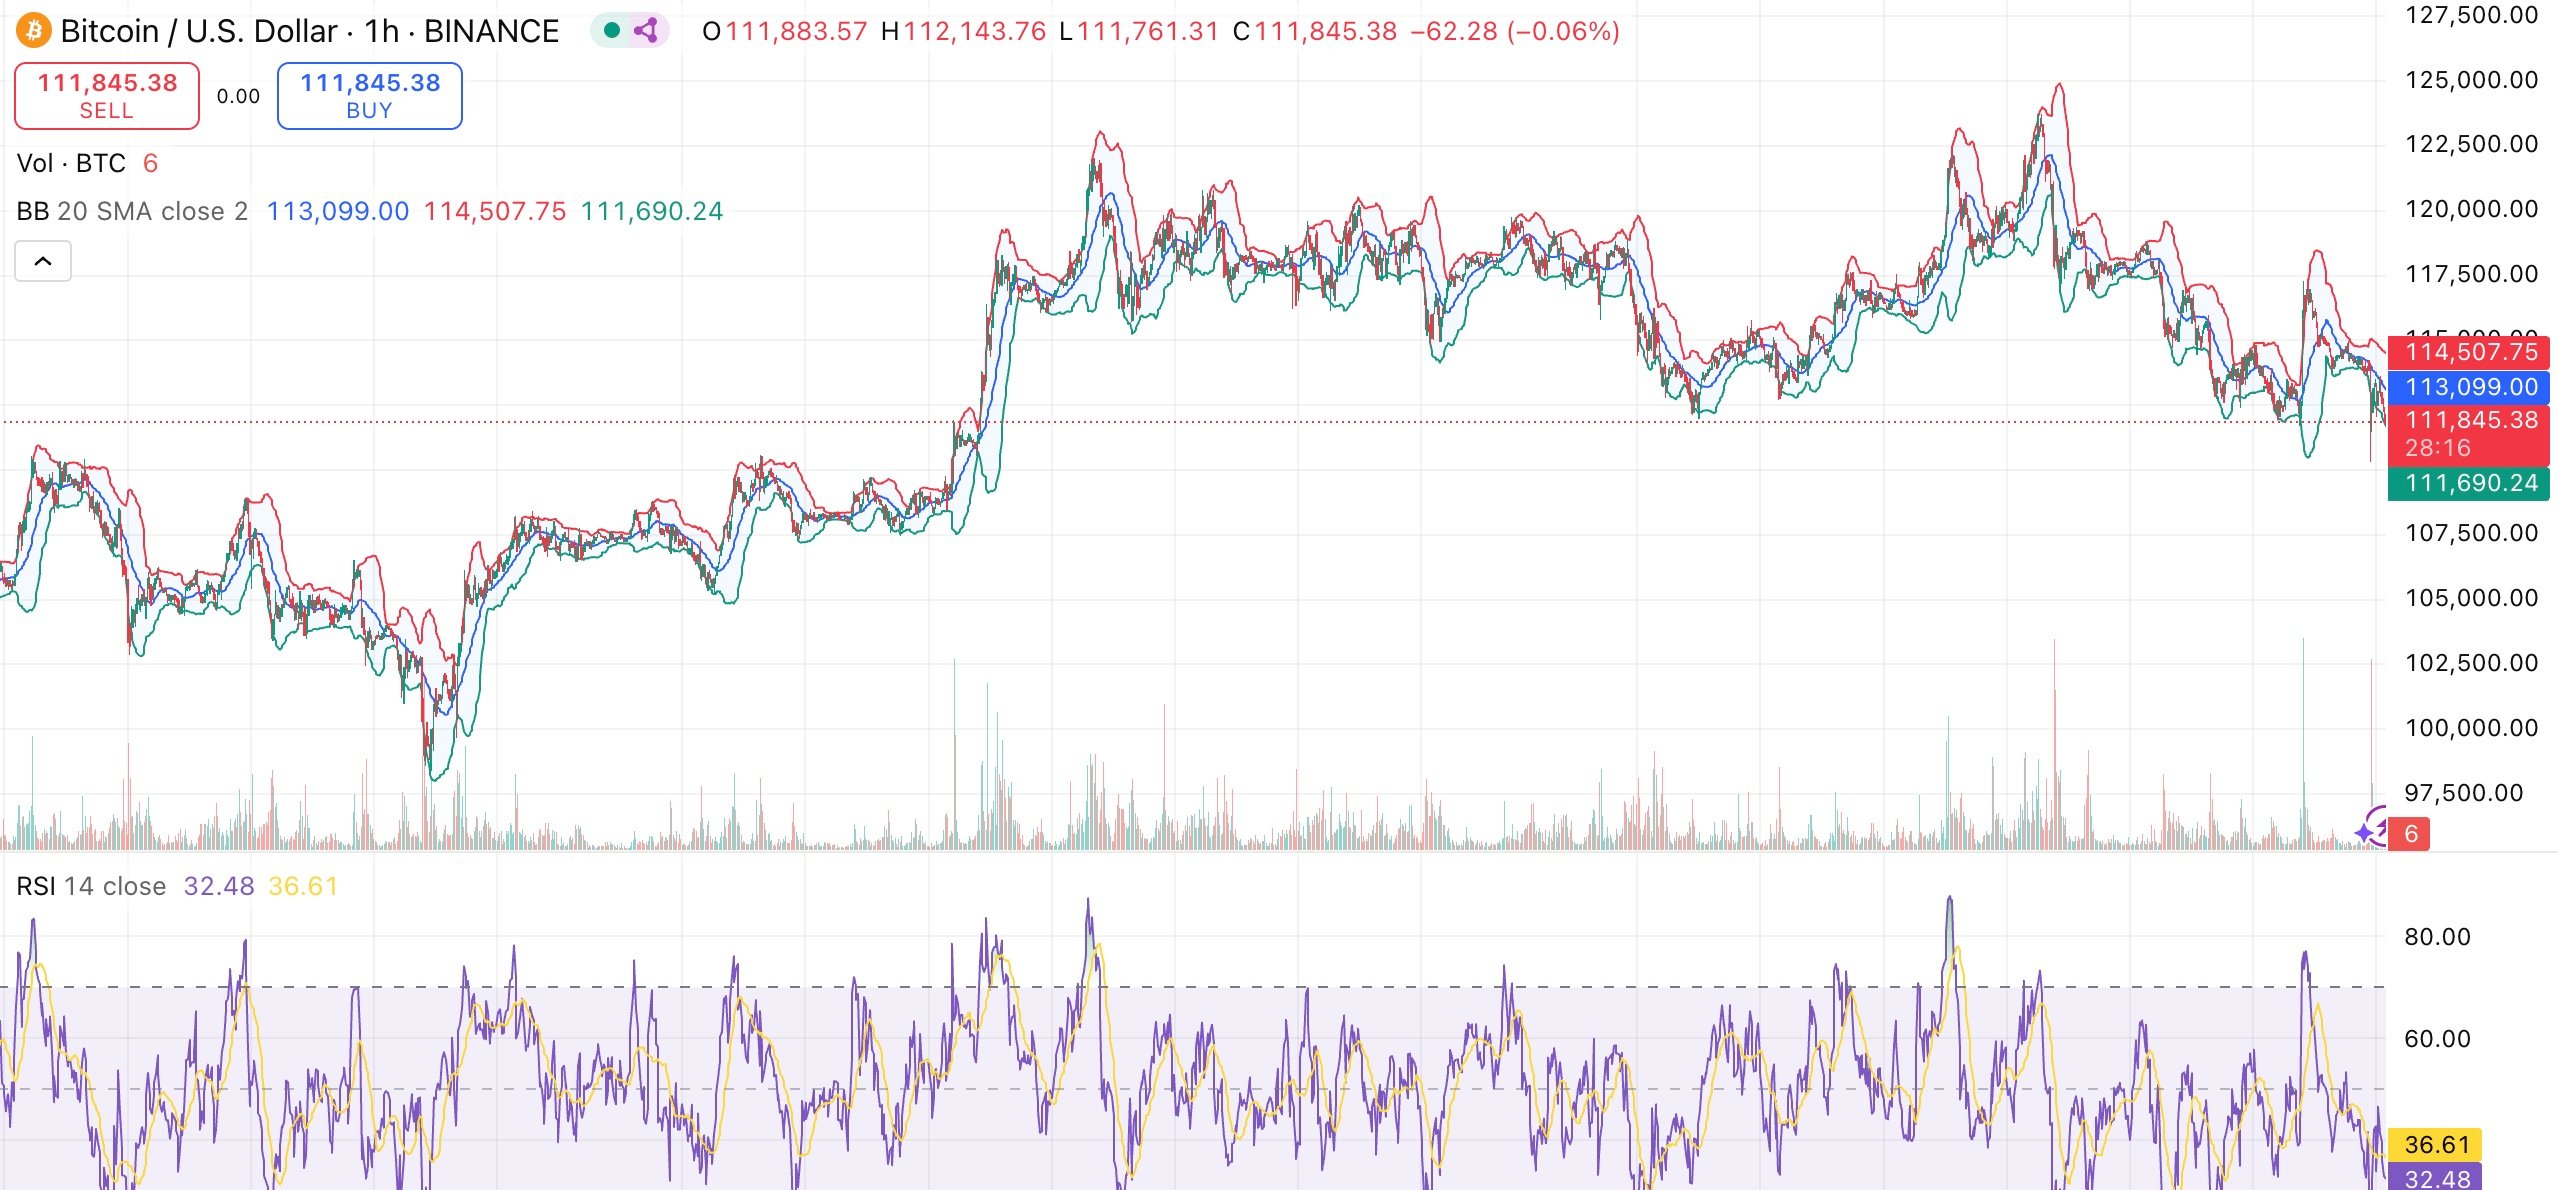
Bitcoin fell back to the $112,000 range, extending its weekly losses, even as its Realized Cap exceeded $1 trillion for the first time.
Summary
- Bitcoin drops to $112K, deepening its weekly losses.
- Realized Cap exceeds $1T, indicating record capital inflows.
- Ethereum gains traction with increased whale accumulation.
On August 25, Bitcoin (BTC) retreated to $112,378, reflecting a 2.2% decline in the last 24 hours and extending its weekly losses to 2.6%. This downturn positions the largest cryptocurrency at the lower end of its seven-day range, which spans from $112,023 to $117,016. Over the past month, BTC has dropped about 4%, cooling off after a robust mid-summer rally.
In contrast, Ethereum (ETH) continues to demonstrate resilience. As of the latest reports, ETH was trading at $4,710, slightly down for the day but up 9% over the past week and 26% over the last 30 days. Its recent surge peaked at an all-time high of $4,946 on August 24.
Bitcoin whales rotating into ETH
Some of the oldest Bitcoin holders appear to be shifting their investments towards Ethereum. On August 24, the on-chain monitoring platform Lookonchain reported a significant transaction involving a long-dormant BTC wallet that moved 6,000 BTC, valued at approximately $689.5 million, into ETH.
This wallet has accumulated a total of 278,490 ETH ($1.28 billion) at an average price of $4,585 and still retains 135,265 ETH ($581 million), indicating a strong belief in Ethereum’s potential.
Ethereum has also seen increasing inflows in exchange-traded funds and has garnered more interest from treasury companies. These whale movements reinforce ETH’s strength in recent weeks, as traders speculate that this capital rotation might maintain Ethereum’s momentum while Bitcoin continues to consolidate.
Bitcoin Realized Cap surpasses $1 trillion
Despite its short-term pullback, Bitcoin achieved a significant on-chain milestone. On August 24, CryptoQuant contributor Burakkesmeci noted that Bitcoin’s Realized Cap exceeded $1 trillion for the first time.
Unlike traditional market capitalization, which multiplies supply by the latest price, Realized Cap assesses coins based on the price at which they were last transacted. This measure reflects the “real” capital that has flowed into Bitcoin as opposed to just the nominal market value.
The $1 trillion benchmark indicates unprecedented levels of liquidity entering the network, suggesting the rally is driven by genuine investment rather than speculative hype.
“Just wait until Realized Cap hits $2 trillion — then you’ll really see our little guy shine,” Burakkesmeci commented in his CryptoQuant analysis.
Bitcoin technical analysis
Bitcoin presents mixed signals. The MACD remains in bearish territory, suggesting that downward pressure has not fully dissipated, while the relative strength index hovers around 48, indicating neutral momentum. Oversold conditions are also indicated by momentum indicators such as the Stochastic RSI, pointing to a potential slowdown in selling activity.

Short-term moving averages tell a cautious tale. Bitcoin is trading below both its 10-day and 20-day exponential moving averages, indicating ongoing weakness. However, the longer-term trend remains favorable, with both the 100-day and 200-day moving averages still trending upward, suggesting structural support beneath current levels.
Traders are looking for a potential rebound towards the $115,000–$117,000 resistance zone if Bitcoin remains above $110,000. Conversely, a deeper decline towards the $105,000 mark could occur if it slips below $110,000.

