Solana experienced a rocky August as the token consistently attempted to stay above $210 but failed to gain traction, falling back into the established range. As of now, the Solana price hovers around $205, reflecting a 4.5% decline in the last 24 hours and approximately 1% lower over the week. However, monthly gains exceed 13%, and the yearly trend remains robust with an increase of nearly 50%.
Nonetheless, September may pose challenges to this upward trajectory, as on-chain and technical indicators suggest potential vulnerabilities.
Supply in Profit Approaches Six-Month Peak
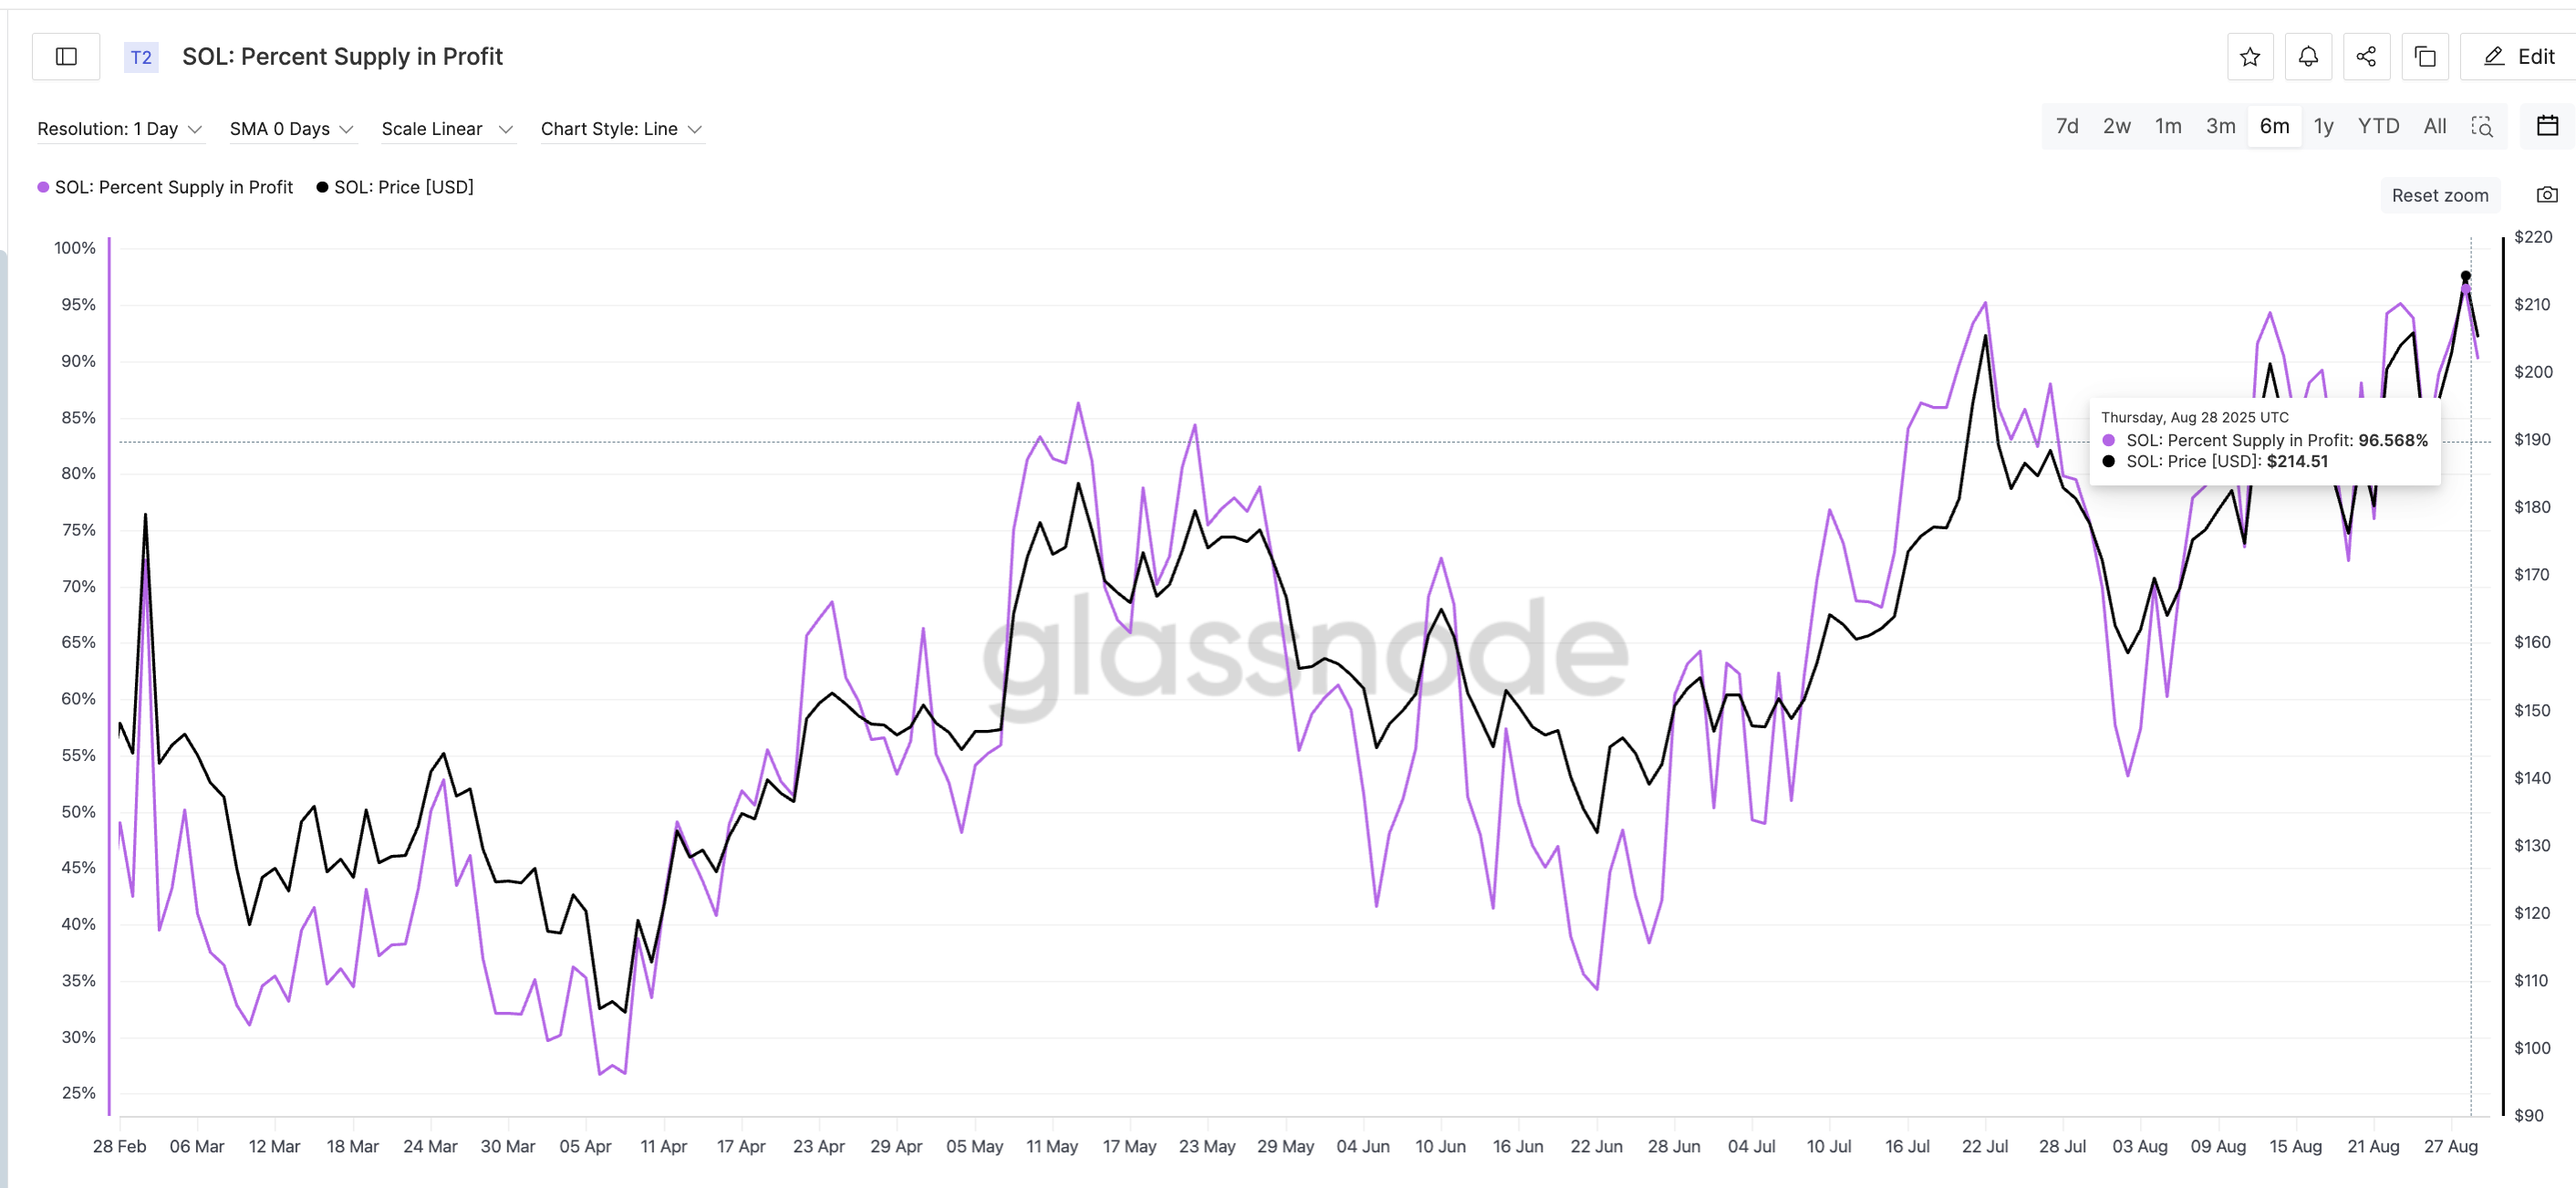
A key metric to monitor is the percentage of supply in profit, indicating how many coins currently hold value above their acquisition cost.
This metric reached a six-month high of 96.56% on August 28, before slightly retreating to about 90% currently.

Historically, such highs have often preceded price corrections in Solana. For instance, on July 13, when the metric touched 96% with the Solana price around $205, it was followed by a 23% drop to $158.
Similarly, on August 13, the metric peaked at 94.31%, leading to a 12% correction from $201 to $176. Later, on August 23, another peak at 95.13% caused an 8% decline from $204 to $187.
With the metric now close to record highs, the likelihood of a deeper correction in SOL price in September is increasing.
For regular token technical analysis and market insights: Interested in more updates like this? Subscribe to Editor Harsh Notariya’s Daily Crypto Newsletter here.
Exchange Balances Amplify Selling Pressure
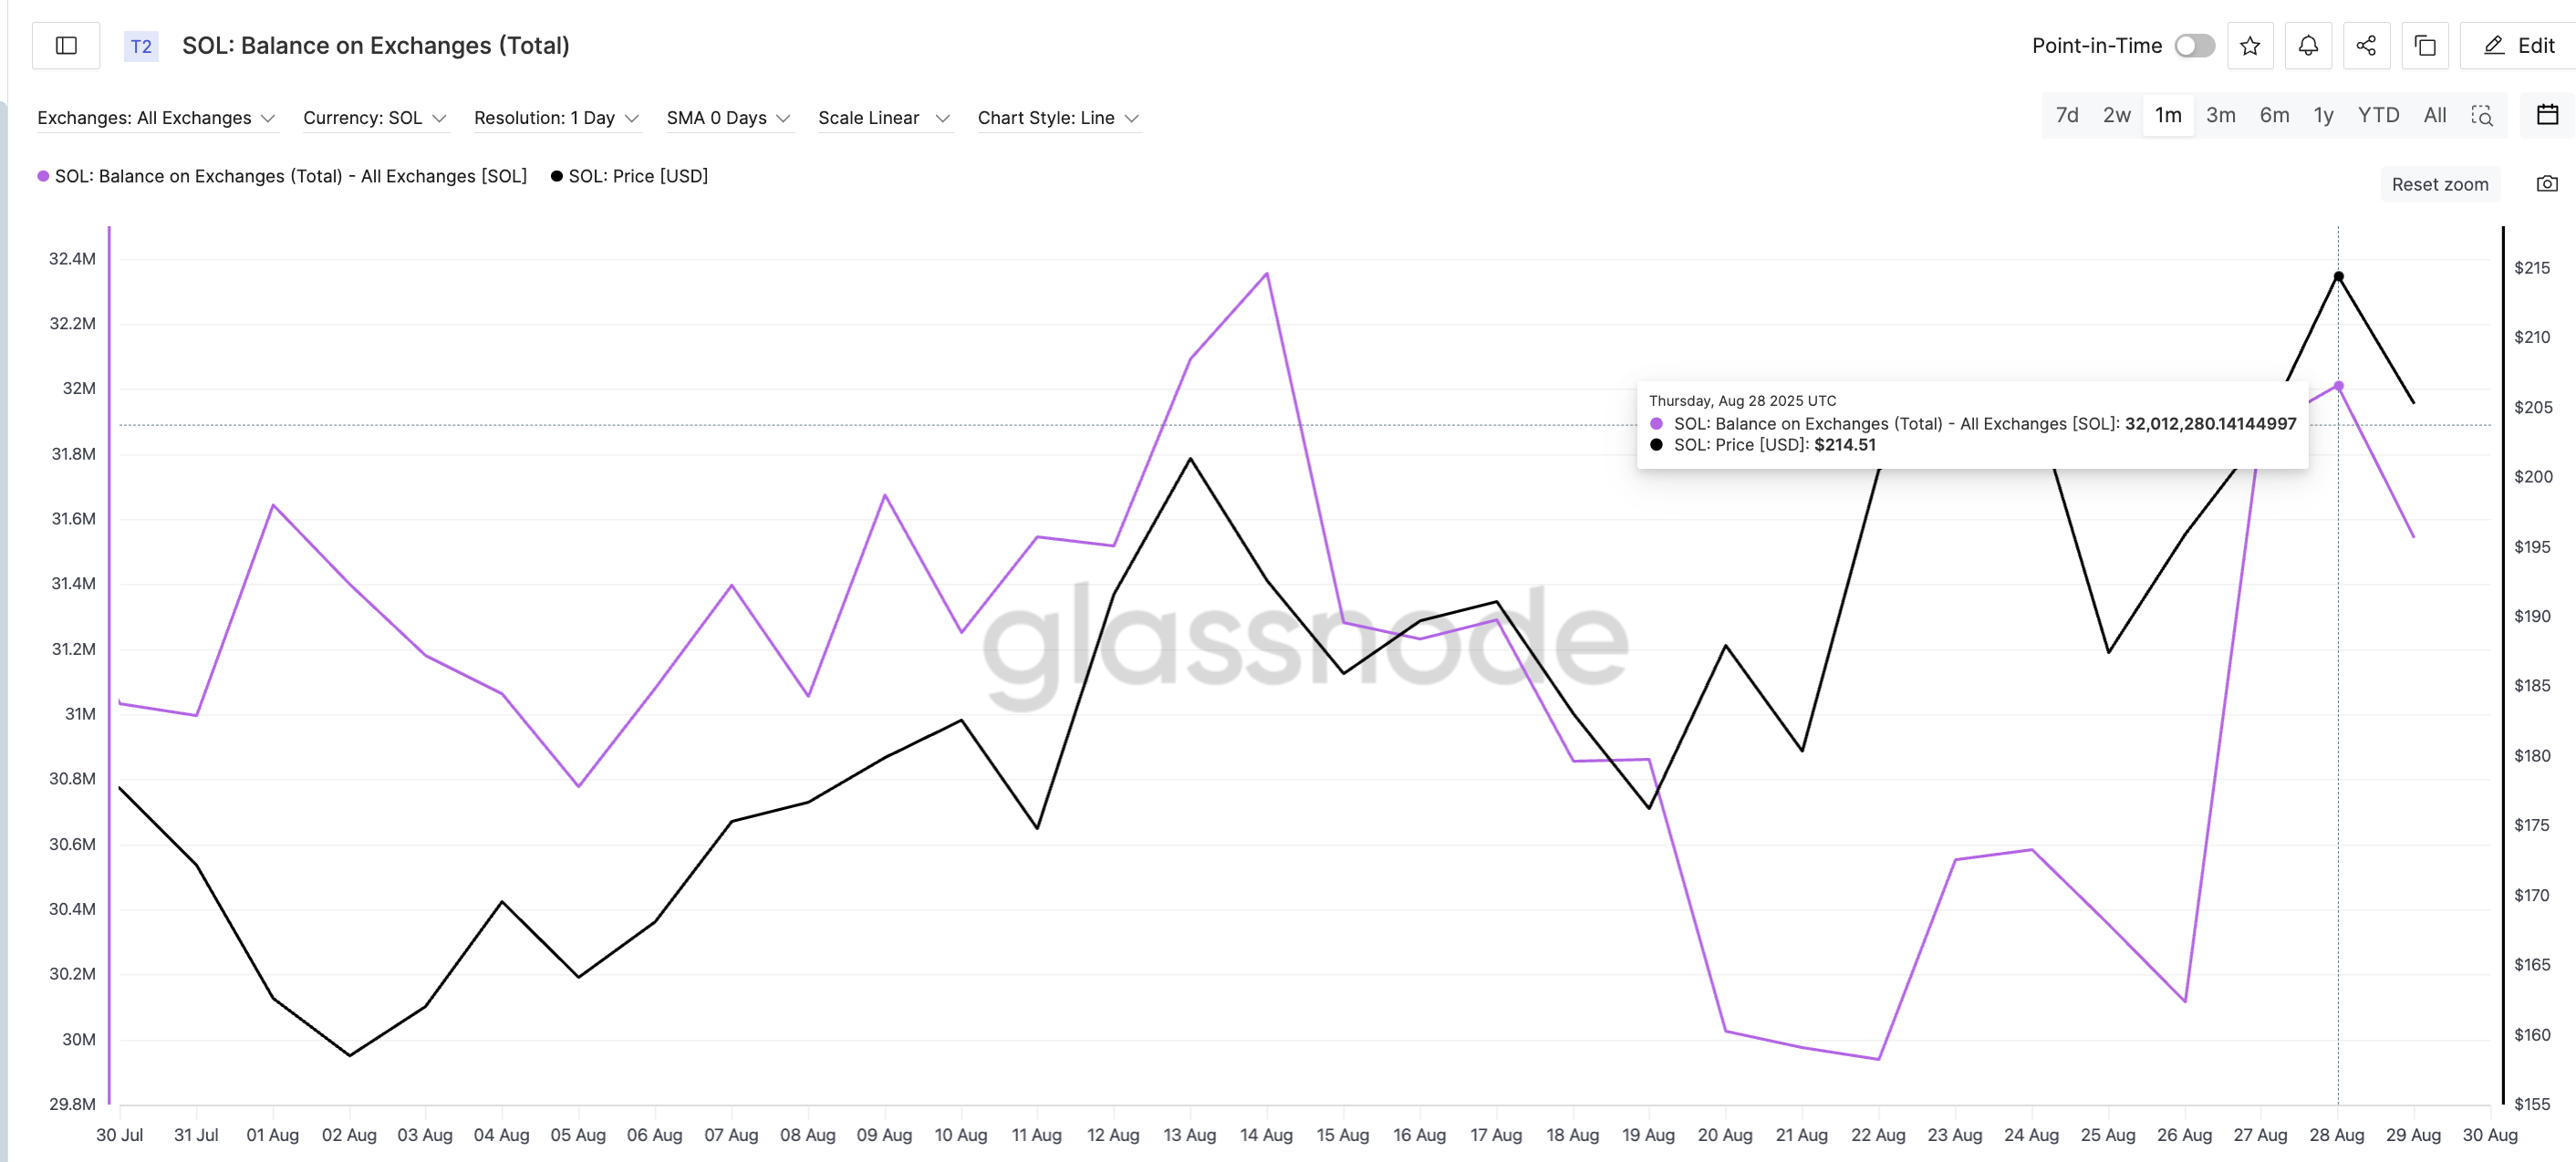
This selling pressure is further supported by exchange balances. The quantity of SOL held on centralized exchanges increased to over 32 million tokens on August 28, rising from below 30 million earlier in the month. Ascending balances typically indicate that holders are preparing to sell.

The correlation is evident. On August 14, when balances exceeded 32 million, the Solana price dropped 8% from $192 to $176 within days.
Now, with balances rising again, a similar scenario appears to be in play, indicating renewed downward pressure that could affect SOL price in September.
Solana Price Pattern Indicates Bearish Setup Despite Positive Trends
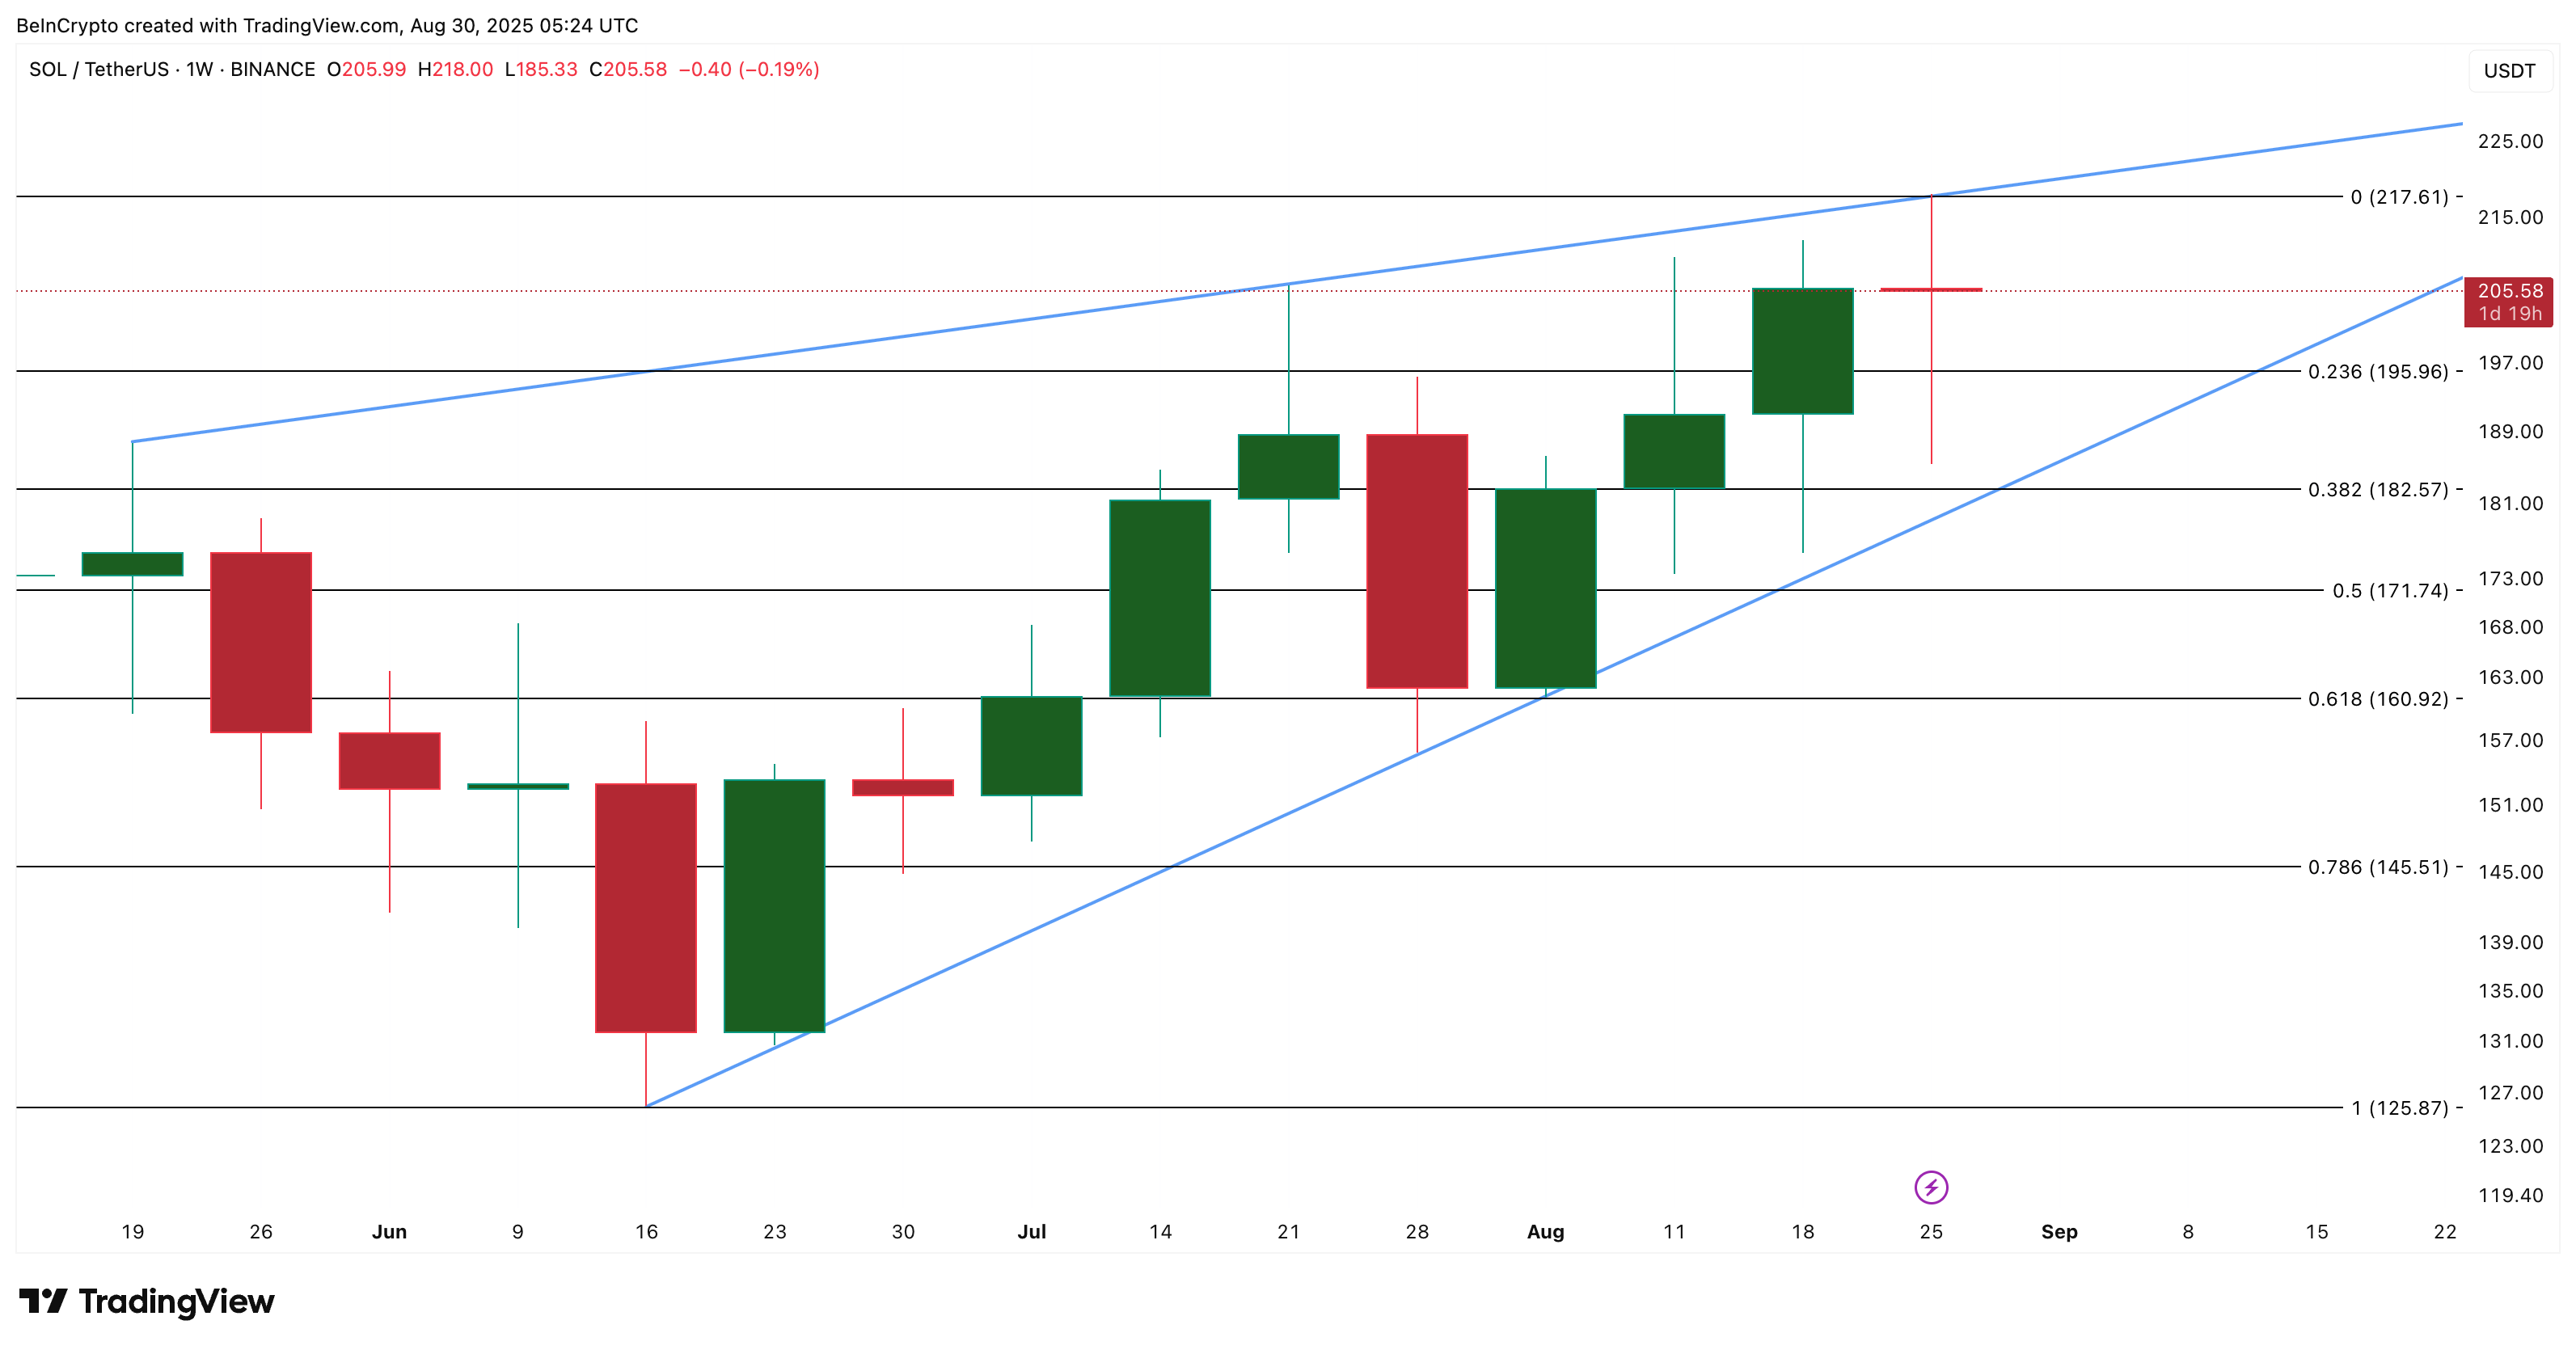
Technical indicators also align with this bearish view. Solana is currently forming an ascending wedge on the weekly chart — a pattern that often signifies weakening momentum and can lead to either bearish continuation or reversal.
If the Solana price drops below $195 and $182, the downturn could extend to $160, representing another potential pullback of 15-20%. Interestingly, previous pullbacks coincided with spikes in exchange balances and the percentage of supply in profit. A break below $182 would further confirm the bearish pattern breakdown.

Nevertheless, bulls have the opportunity to regain strength. A weekly close above $217 — the last local high — would negate the wedge’s bearish implications and pave the way for higher targets. Until that occurs, the outlook remains downward.
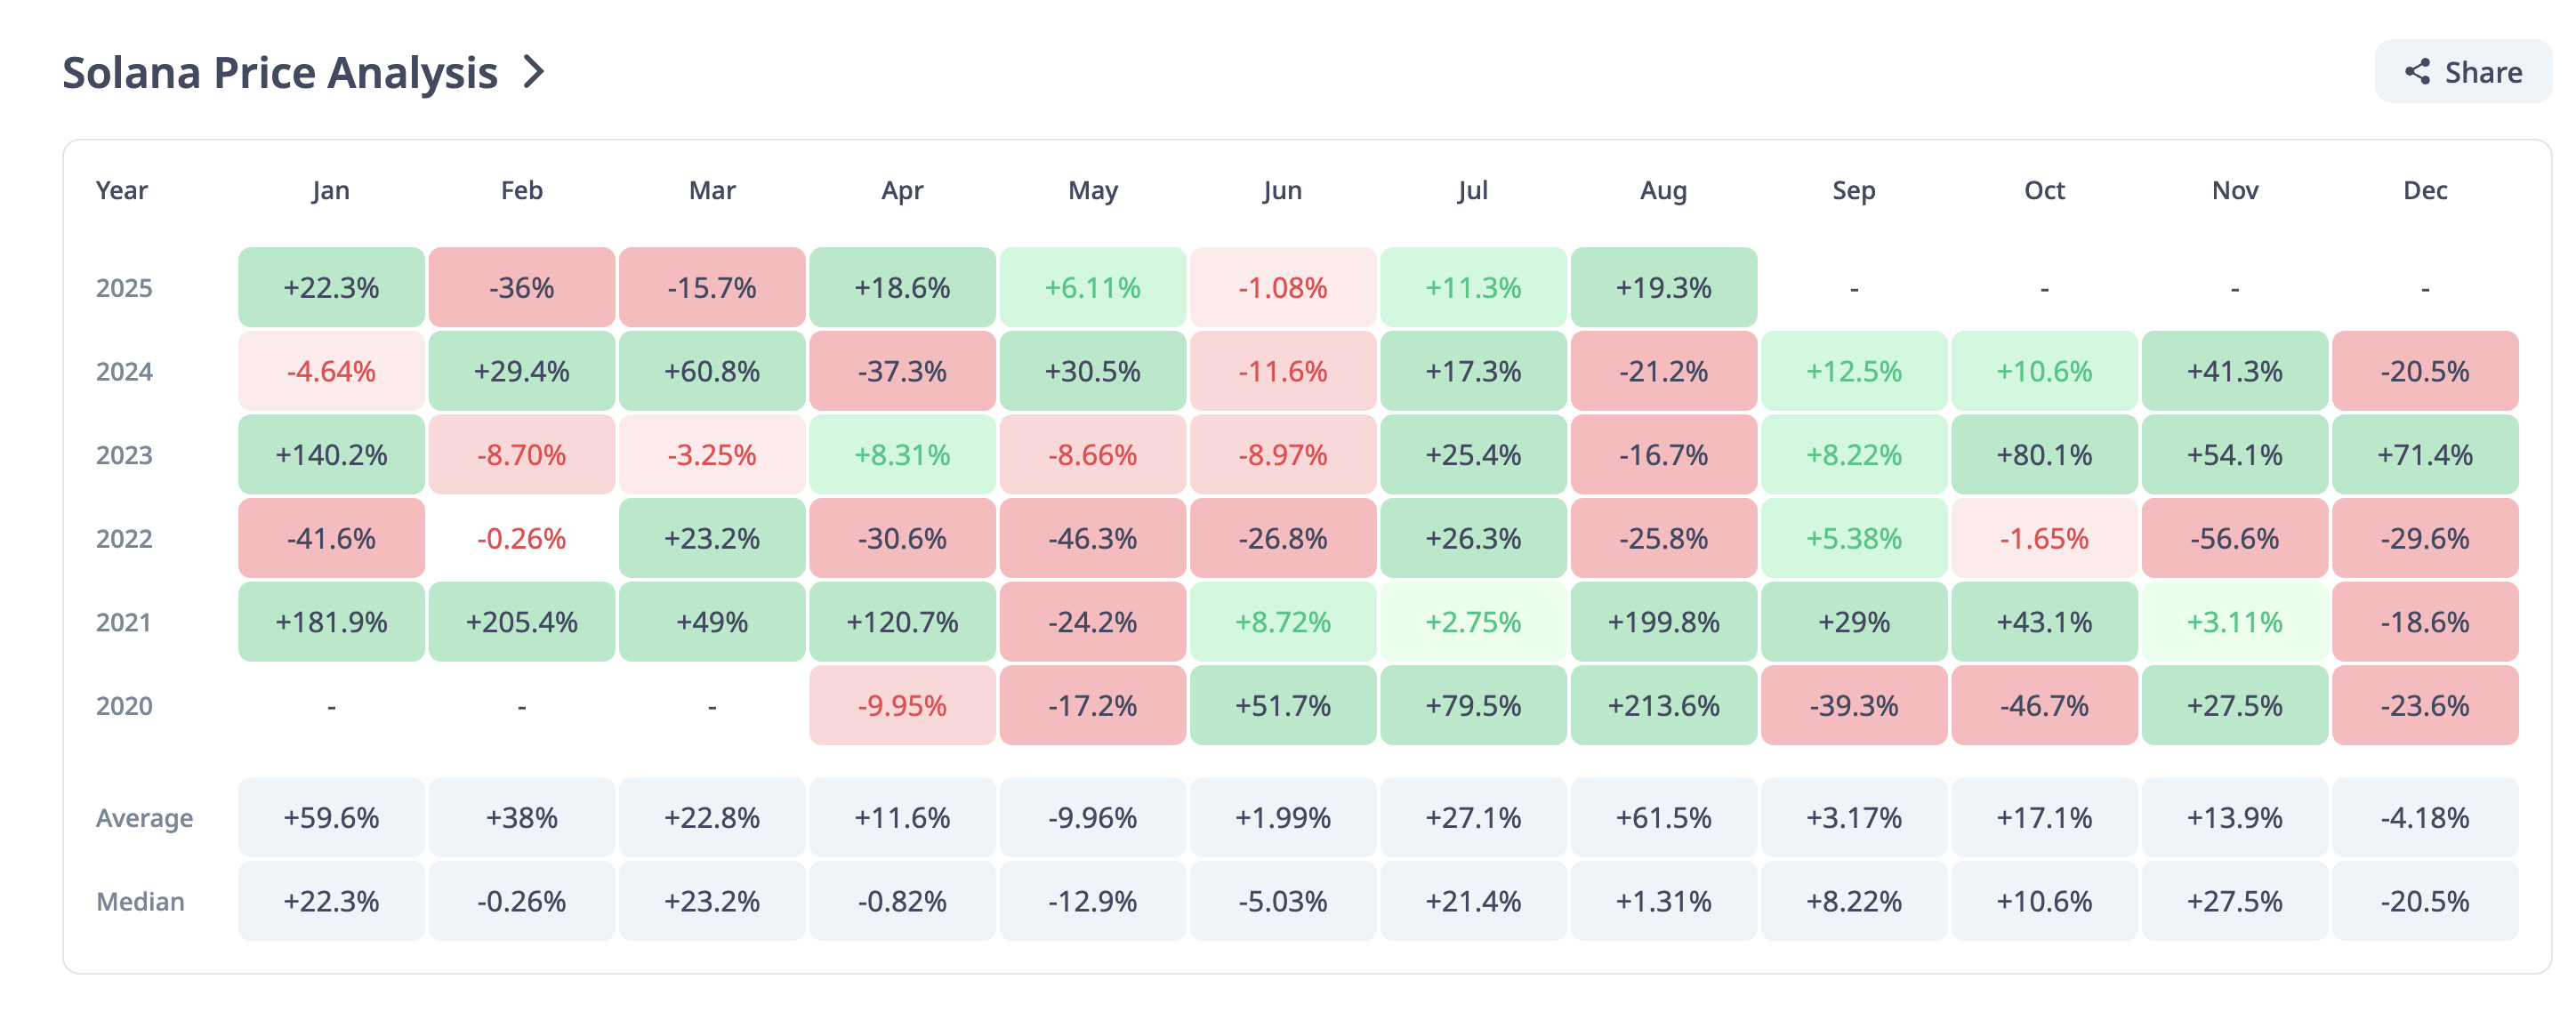
This bearish technical framework exists against a backdrop of generally positive seasonality. Since 2021, Solana has recorded September gains of 29%, 5.3%, 8.2%, and 12.5%. However, with supply in profit at peak levels and exchange balances elevated, 2025 could be the year this trend ends.

Unless SOL successfully closes decisively above $217, the Solana price in September may struggle, even amid the positive influences of historical performance and ETF-related optimism.
Disclaimer
In compliance with the Trust Project guidelines, this price analysis article serves purely for informational purposes and should not be construed as financial or investment advice. BeInCrypto strives for accurate, impartial reporting; however, market conditions can change unexpectedly. Always perform your own research and consult with a professional before making any financial decisions. Please be aware that our Terms and Conditions, Privacy Policy, and Disclaimers have been updated.

