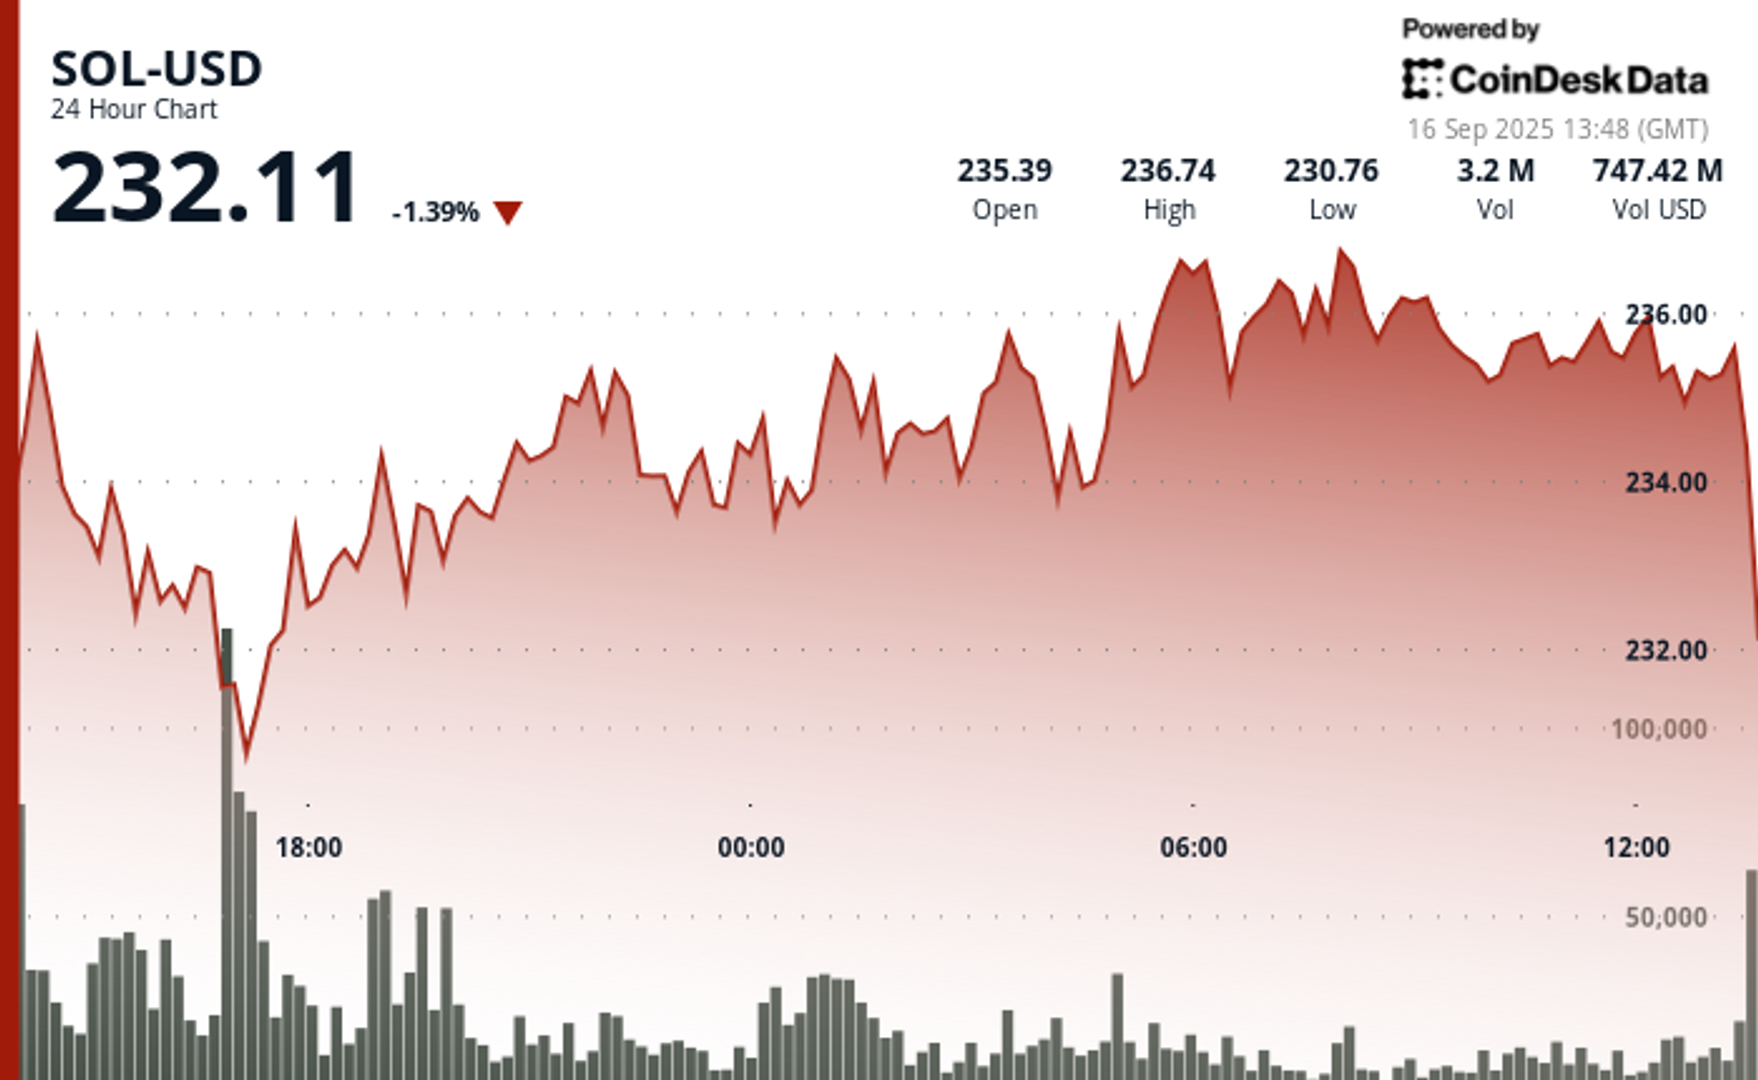
As per CoinDesk Data, Solana’s SOL was priced at $232.11 as of 12:30 UTC on September 16, maintaining stability after a volatile day where it tested both the $230 and $238 thresholds.
Analyst’s Perspective
Altcoin Sherpa, a well-known trader, mentioned earlier today on X that he believes SOL and BNB present stronger investment opportunities compared to ETH. He observed that incoming funding and market dynamics seem to favor SOL, whereas ETH has already experienced significant upward movement and might require some time to stabilize.
He further noted that major cryptocurrencies tend to move in correlation with BTC: if BTC declines, it’s unlikely that SOL, BNB, or ETH will continue their upward trajectory. However, if Bitcoin rises due to favorable macroeconomic developments, he anticipates that major tokens will follow suit, with SOL and BNB likely outpacing others. Sherpa expressed that he holds long positions in both SOL and BNB, while his investment in ether is relatively minor.
CoinDesk Research’s Technical Assessment
According to the technical analysis data model from CoinDesk Research, SOL traded within an $8 range during the analysis period of September 15–16, fluctuating between a high of $238.09 and a low of $230.13.
The most significant selling activity occurred between 12:00 and 17:00 UTC on September 15, when SOL experienced a nearly $8 drop from peak to trough. Volume surged to 1.5 million units during this slide, indicating heavy selling pressure.
Subsequently, buyers consistently defended the $233–$234 range, creating a short-term “floor.” SOL consolidated with volume around 650,000 units, reflecting a combination of institutional selling and retail buying.
Toward the session’s conclusion, price behavior improved. Between 07:00 and 08:00 UTC on September 16, SOL broke free from a tight $235.52–$236.50 range, momentarily rising to $236.90 on a 46,000-unit surge in just a few minutes. This spike directed the price towards the $237.50–$238 resistance zone before the momentum slowed.
In summary, the data indicates that SOL is stabilizing after significant fluctuations, with clear support established around $233 and a resistance level developing between $237.50 and $238.
Recent 24-hour and One-Month Chart Insights
The most recent 24-hour CoinDesk Data chart, concluding at 12:30 UTC on September 16, shows SOL at $232.11 after retreating from an intraday range of $236–$237. Trading has constricted into the $232–$234 band, reinforcing this area as short-term support.
The one-month chart reveals that SOL continues to show an overall upward trend, though the recent pullback indicates that the token is currently testing its support base rather than making further gains. This consolidation suggests the token might need to build momentum before another upward movement.
Disclaimer: Some parts of this article were produced with the help of AI tools and reviewed by our editorial team to ensure accuracy and compliance with our standards. For more details, please refer to CoinDesk’s complete AI Policy.

