The current Aave price rally may be coming to a close as a precarious chart pattern emerges and whale accumulation slows.
Summary
- Aave price has surged by 185% since hitting its lowest point in April.
- A double-top pattern has developed on the weekly chart.
- Whale and smart money activity has diminished over the past two weeks.
Aave (AAVE) token peaked at $326 over the weekend, marking a rise of over 175% from its April low. It is currently close to its December 2024 highs, providing a market capitalization of nearly $5 billion.
The Aave price has shown strong upward momentum in recent months, coinciding with enhanced network growth. Data from DeFiLlama indicates that the total value locked in its ecosystem has reached a record of $41 billion, nearly double its starting figure for the year.
According to its website, the liquidity supplied on its platform has climbed to over $63 billion, surpassing many American banks in size.
This expansion has led to a significant rise in its monthly fees. As reported by TokenTerminal, it generated $80 million in fees, reflecting a 7.2% increase from July’s $74.7 million and June’s $50 million.
The increase in fee collection has also enhanced the value of its treasury, which now stands at $235 million, up from $176 million in April.
Despite the network’s success, indicators suggest that the price may begin to lose steam. Data from Nansen reveals that whales hold 183,116 AAVE tokens valued at over $59 million. Although holdings have increased by 15% in the past 30 days, no purchases have been made since August 14.
Smart money investors, recognized for their low-buy and high-sell strategy, have decreased their holdings to 293,000, down from a monthly peak of 294,000, suggesting they anticipate a pullback in AAVE price.
Furthermore, token supply on exchanges has risen to 5.42 million from a low of 5.4 million earlier this month, indicating that investors have begun to offload their tokens.
AAVE price technical analysis

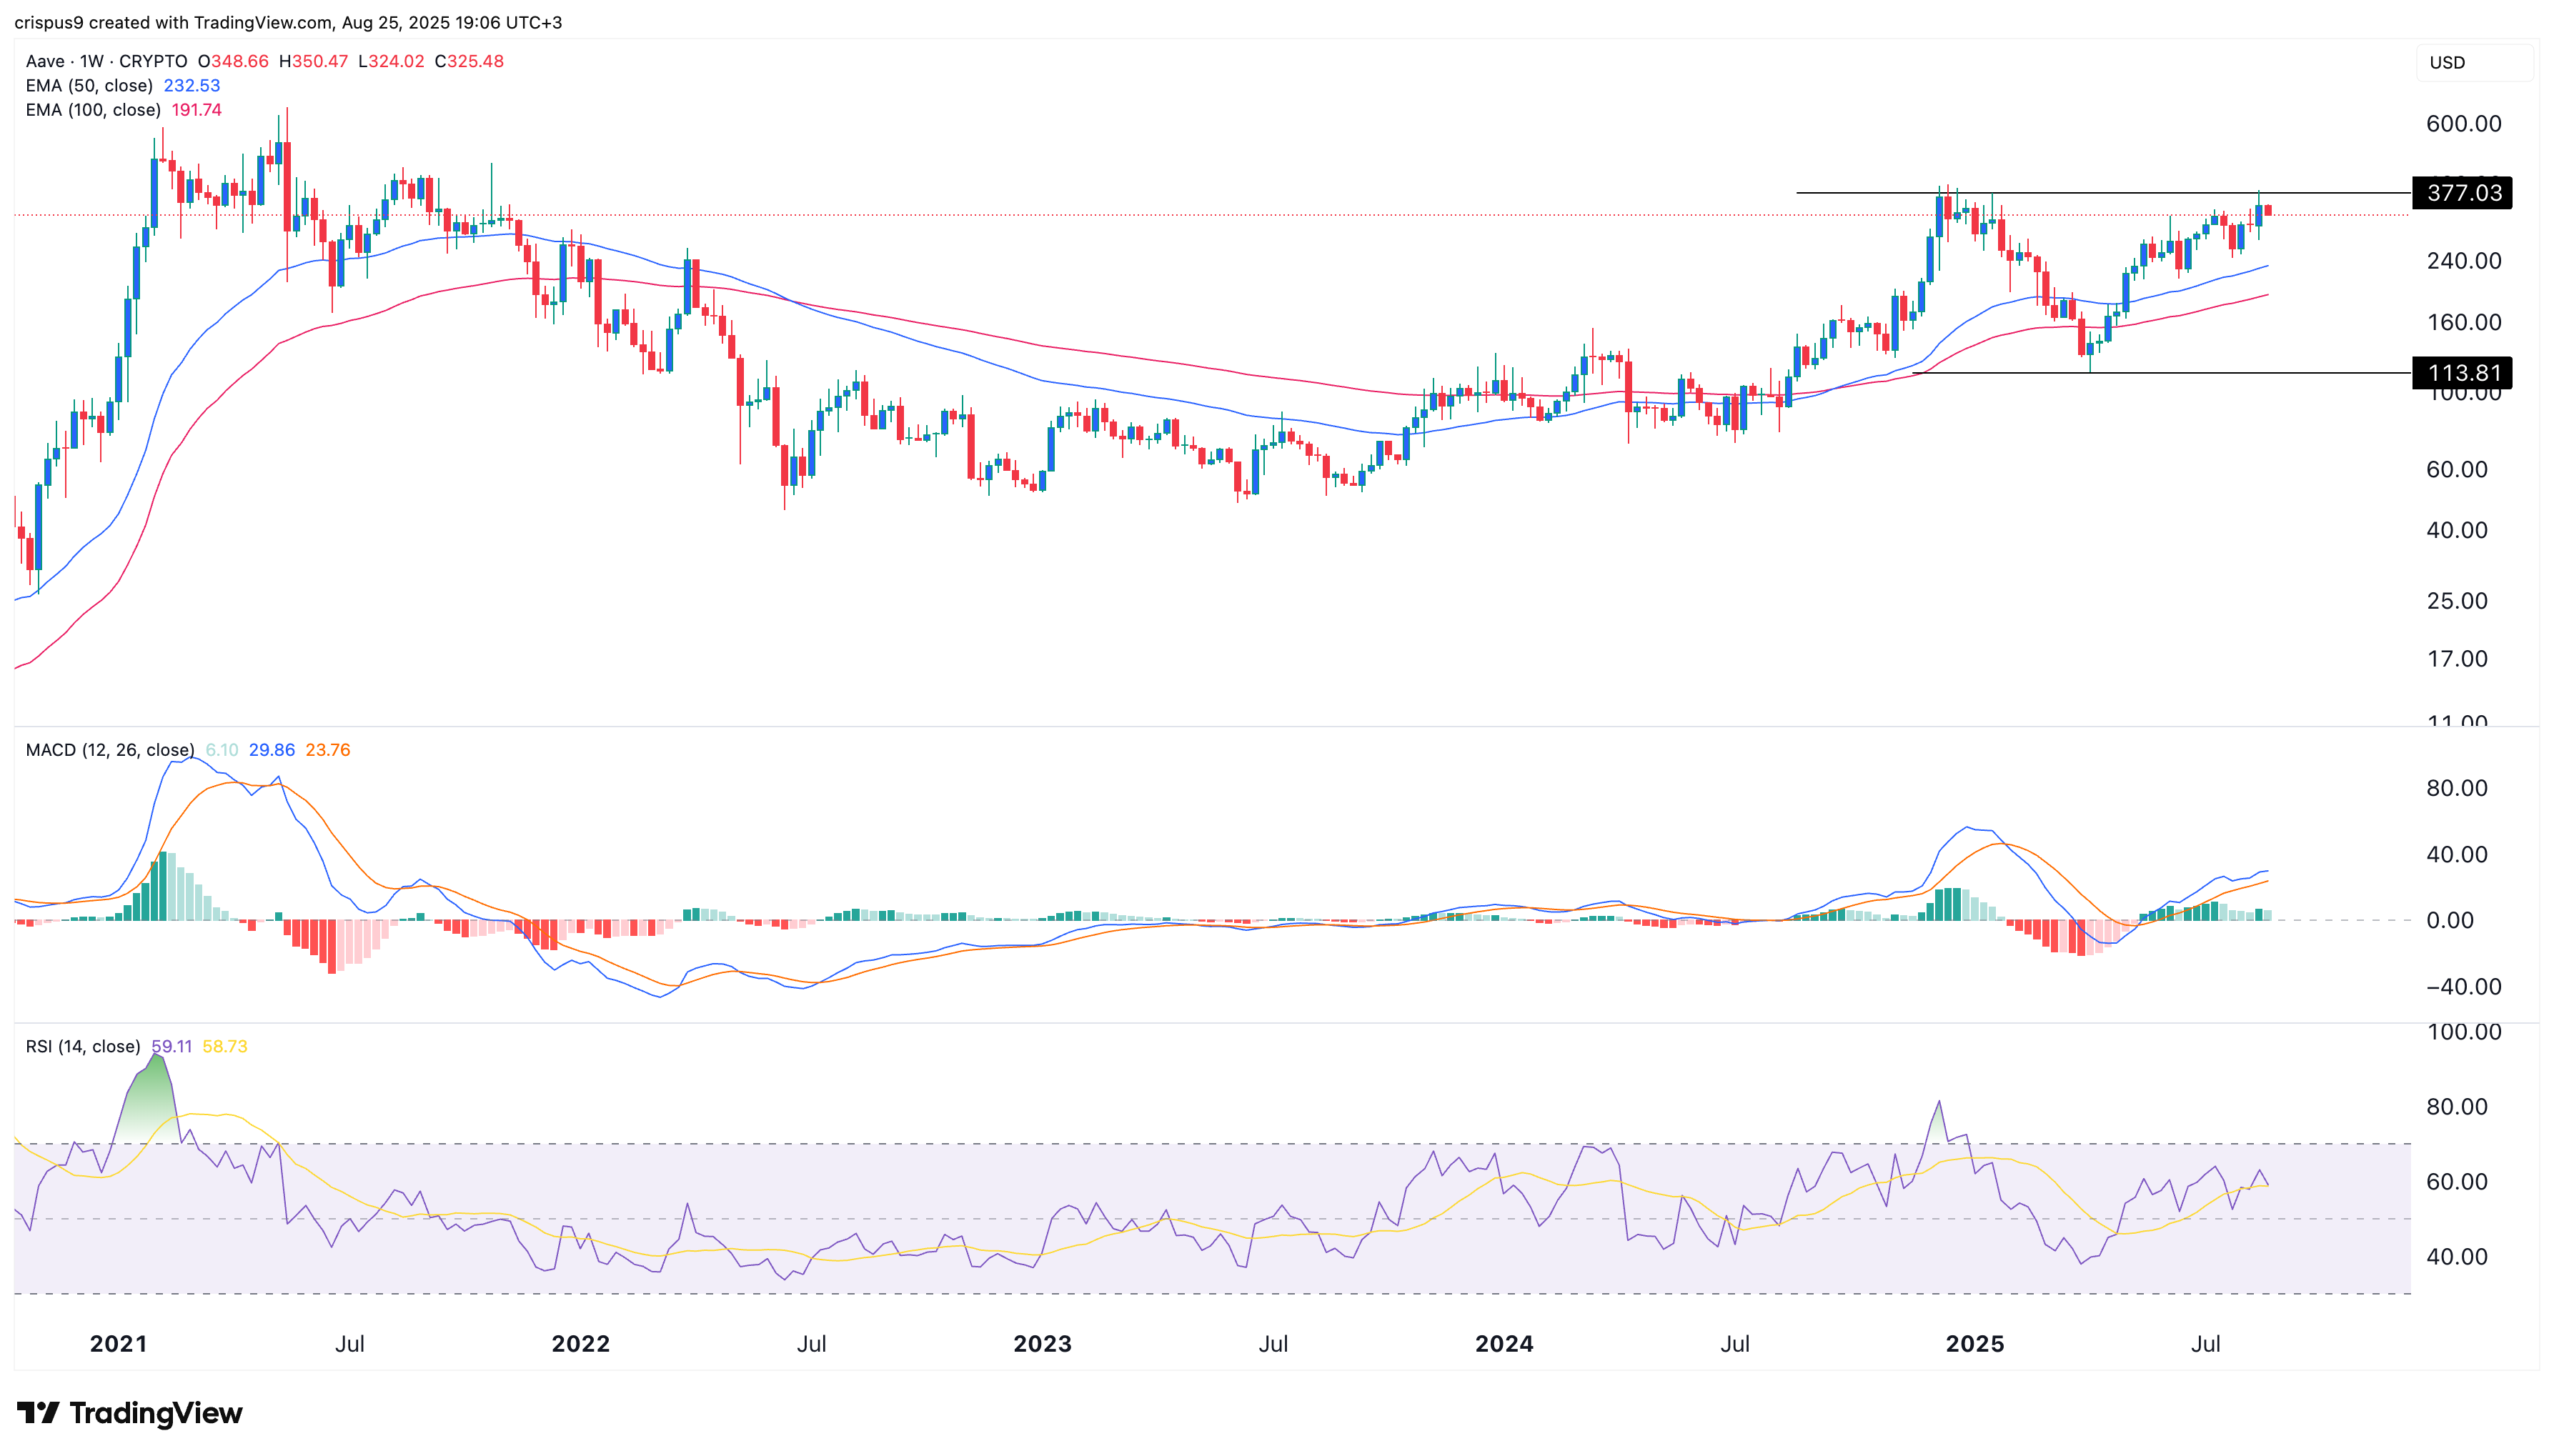
The weekly chart indicates that AAVE has been experiencing an uptrend in recent weeks, climbing to a high of $377 from the April low of $113.
AAVE has consistently stayed above the 50-week and 100-week Exponential Moving Averages, which is considered a bullish indicator. However, there is a possibility that a double-top pattern has formed, with the neckline at $113.8.
As such, the token may experience a pullback as long as it remains below the double-top level of $377. This scenario could see a drop to the 100-day moving average at $190.

