The SUI price may continue to face further losses as the technical indicators remain negative for the asset, despite its recent launch on Robinhood.
Summary
- The SUI price has stayed on a downward trend a day after it began trading on Robinhood.
- The token experienced $5.64 million in long liquidations yesterday.
- The supply of stablecoins on the blockchain has decreased over the past week.
The Sui (SUI) token has been in decline since August 17, entering a consolidation phase within the $3.40–$3.50 range on August 20. At the time of writing, it was trading at $3.47, which is a 16% drop from its monthly peak and a 34% decrease from its yearly high.
The SUI token’s price has continued to drop even after being listed on Robinhood, one of the most prominent cryptocurrency trading platforms in the U.S. While tokens usually gain value upon being listed on reputable exchanges, SUI’s decline may reflect overall bearish sentiment in the market, as Bitcoin (BTC) dipped below $113,000 and Ethereum (ETH) briefly fell under $4,100 earlier today.
SUI’s price also fell as investor sentiment turned more negative. According to data from CoinGlass, open interest in SUI futures has significantly decreased—from $2.66 billion in late July to $1.84 billion today—indicating lower speculative activity and diminished market confidence.
Further data reveals that the long/short ratio has fallen below 1, indicating that more traders are positioning for downward movements. This sentiment shift follows the liquidation of $5.64 million worth of long positions in the previous session.
Onchain data from DeFiLlama also indicates the Sui ecosystem is facing challenges. The total value locked in its decentralized finance dropped by 11% over the last week to $3.4 billion.
The total supply of stablecoins on the blockchain has alsoseen a 16% decline over the same timeframe, now approximately $770 million.
Stablecoins are crucial for on-chain liquidity and trading activities. A decline in their supply often indicates reduced capital inflows and lower user engagement within the ecosystem.
SUI technical indicators remain negative
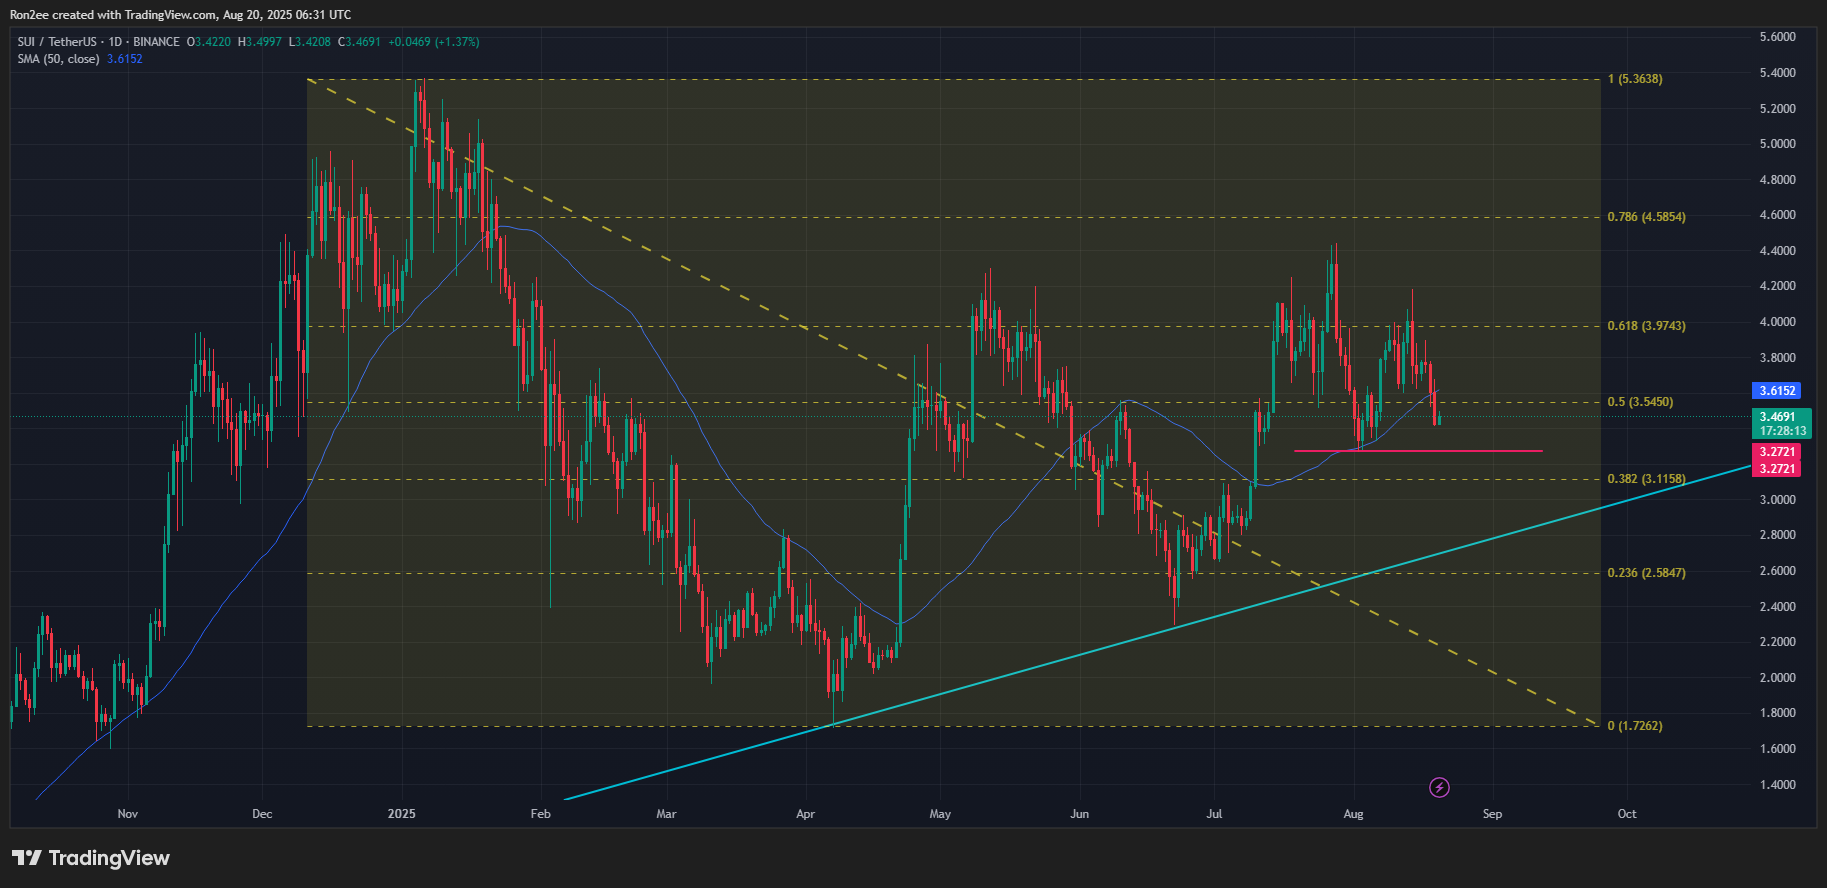
On the daily chart, SUI has fallen below its 50-day moving average, a trend typically seen as a bearish signal by traders.

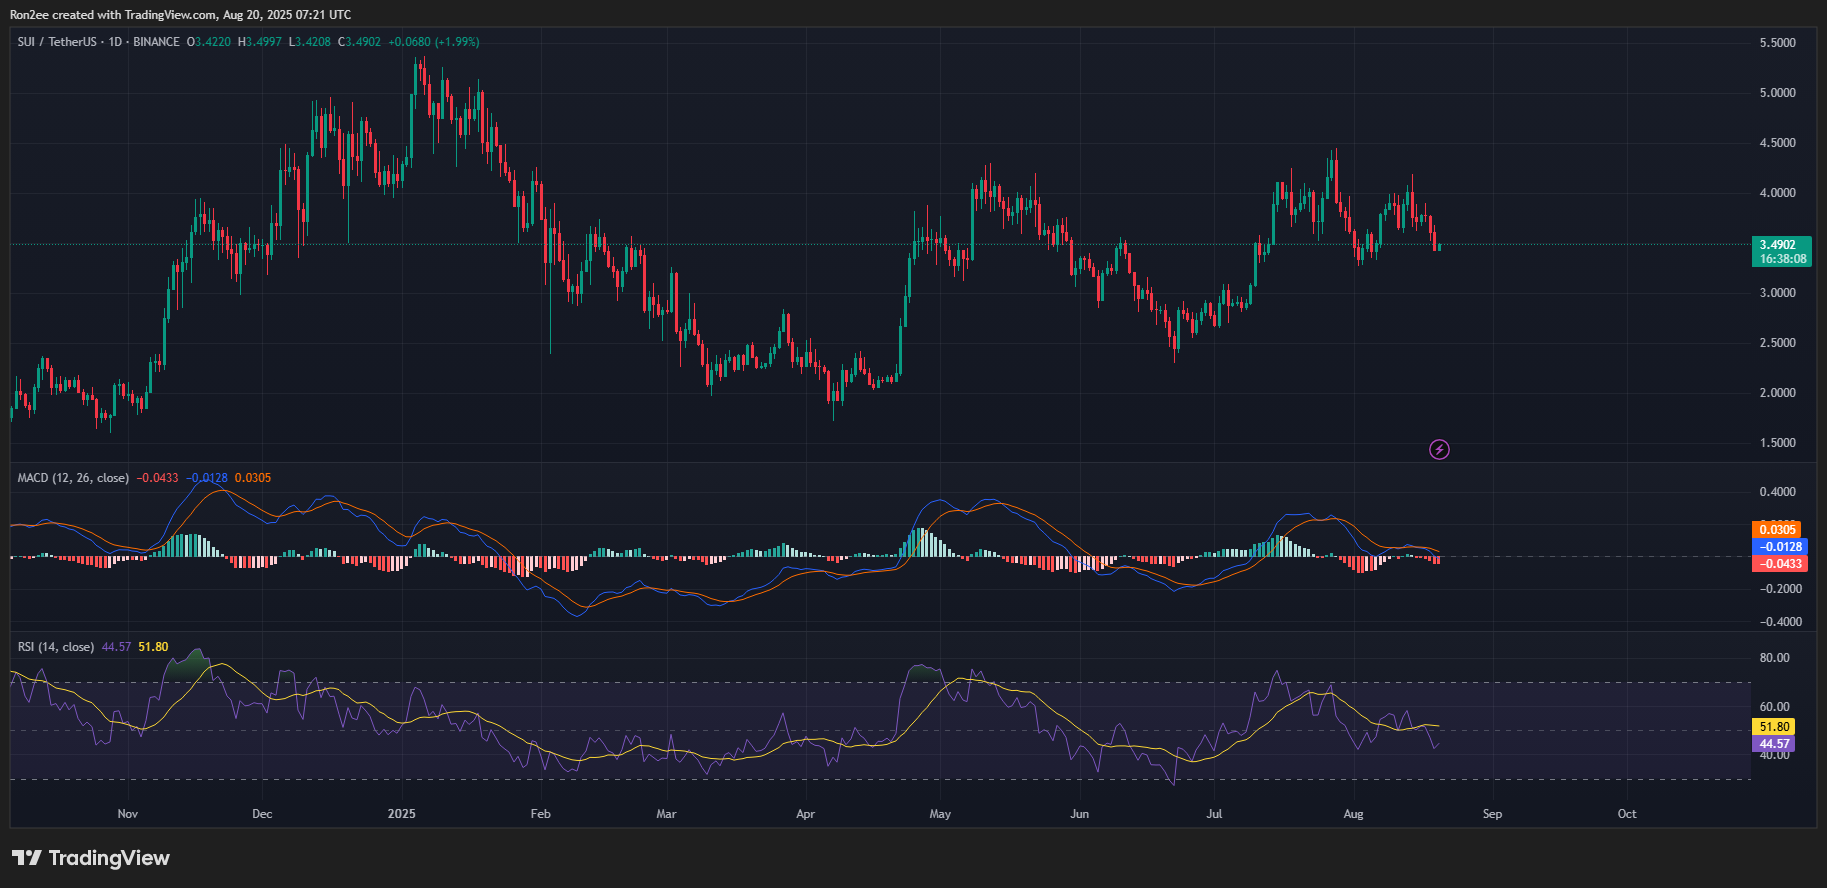
Momentum indicators align with this bearish forecast. The Moving Average Convergence Divergence has crossed below its signal line, with the red histogram bars increasing. Additionally, the Relative Strength Index has dipped to 44, indicating escalating selling pressure.
Given the previous bearish signals, SUI is likely to drop to the $3.27 support level, which marked the monthly low on August 2. A decisive break below this level could result in a fall beneath the psychological $3.00 mark.

Conversely, there might be a potential bullish reversal if the price tests and bounces off a rising trendline that has offered support multiple times since April. Historically, SUI has rebounded from this trendline each time it was tested, suggesting it remains a vital area to monitor for a possible recovery.
Disclosure: This article does not constitute investment advice. The content and materials presented on this page are solely for educational purposes.

