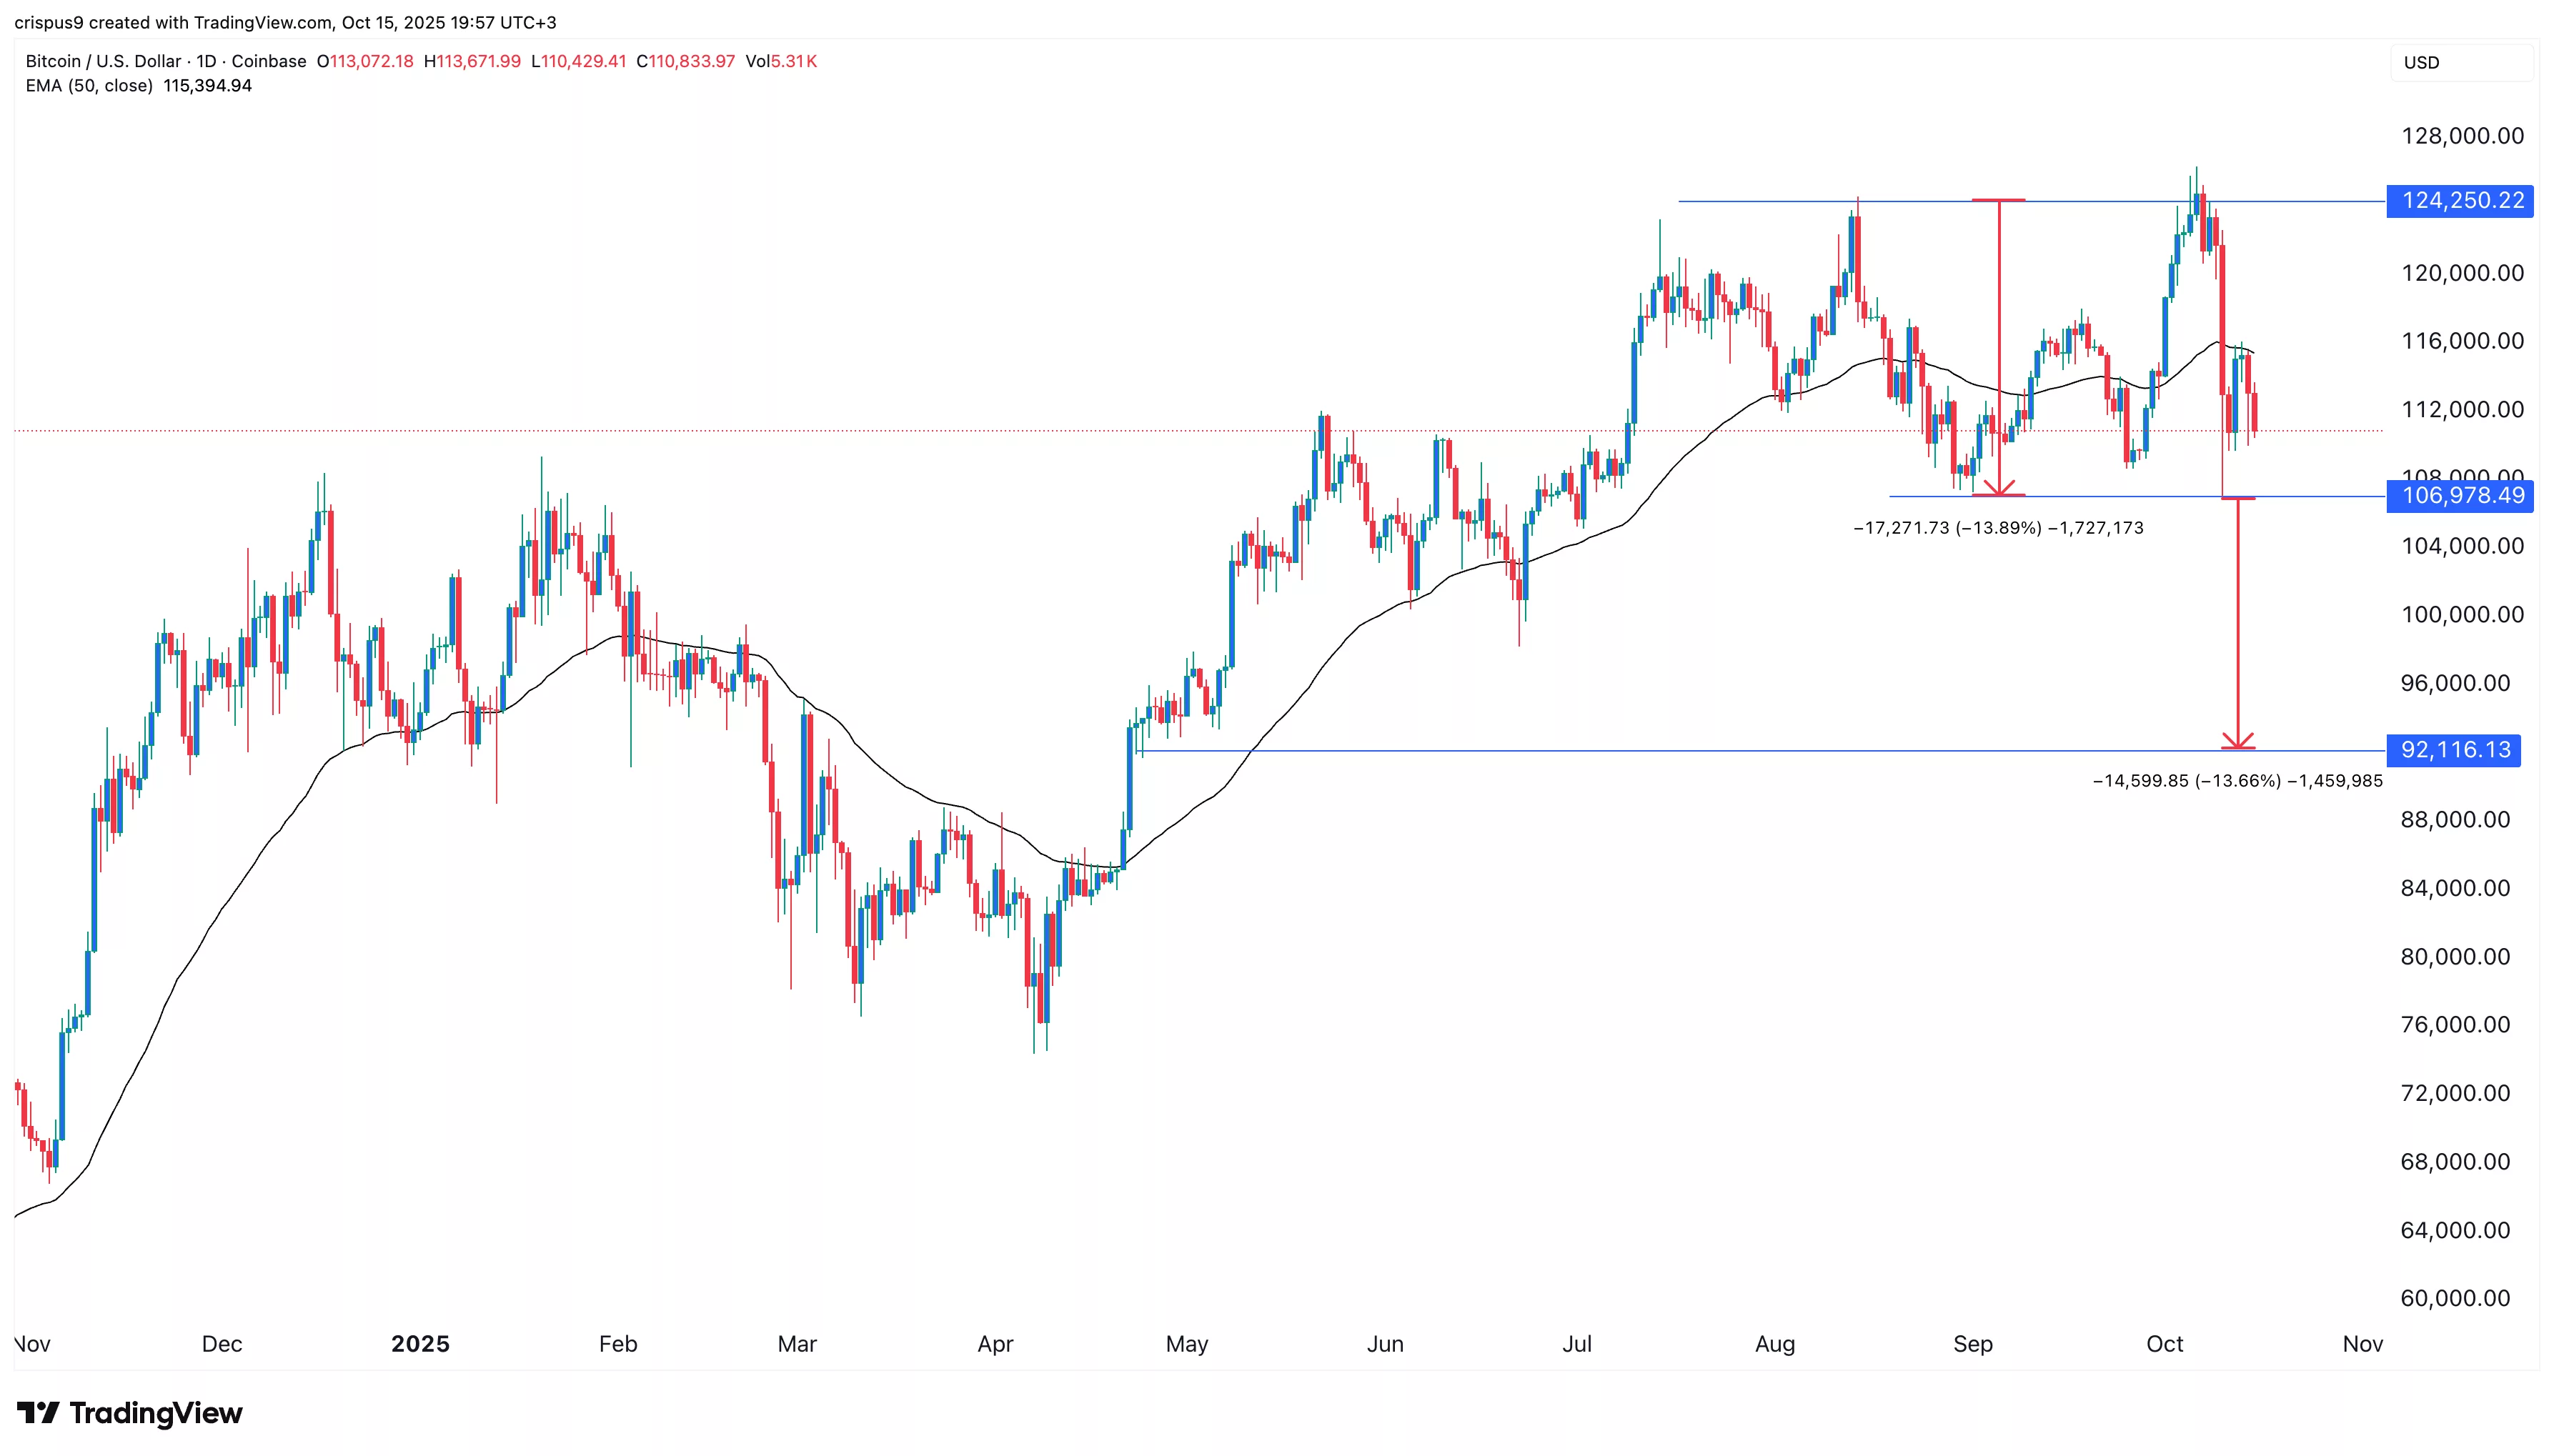
The price of Bitcoin remains stagnant as gold strengthens its position as a preferred safe-haven asset amidst ongoing trade uncertainties.
Summary
- Bitcoin has developed a double-top pattern on the daily chart.
- Gold has emerged as a superior safe-haven asset, reaching an all-time high.
- Institutional and central bank purchases have fueled its rise.
Gold Outshines Bitcoin as a Safe-Haven Asset
Trading around $110,000, Bitcoin (BTC) is down by 12% from its peak earlier this year, indicating it has entered a phase of technical correction, just above last week’s lows.
In contrast, the price of gold has surged to a historic high of $4,200, rising 60% this year. Meanwhile, Bitcoin’s increase has been less than 20%, widening the gap between the two assets.
The disparity in assets under management between the iShares Bitcoin Trust and the SPDR Gold Trust continues to grow. Currently, IBIT holds $91 billion in AUM, compared to over $138 billion for the GLD ETF.
This divergence in the roles of gold and Bitcoin as safe-haven assets became evident on Friday during the cryptocurrency market downturn. Bitcoin’s price dropped to $106,000 after Donald Trump proposed a 130% tariff on Chinese imports, even as gold’s upward momentum increased.
Ongoing demand from institutional players, retail investors, and central banks is driving gold’s strength. Notably, central banks have increased their gold reserves beyond the U.S. dollar for the first time since 1996.
Nonetheless, Bitcoin’s potential as a safe haven shouldn’t be disregarded. For instance, the newly launched spot Bitcoin ETFs have drawn $27 billion in inflows this year, resulting in total inflows exceeding $62.5 billion.
Moreover, while gold has served as a store of value for centuries, Bitcoin has existed for less than 17 years. Deutsche Bank has even forecasted that central banks will begin purchasing Bitcoin by 2030, which could enhance its value.
Additionally, Bitcoin has outperformed gold in the long run, climbing 861% over the last five years compared to gold’s approximate 105% increase during the same timeframe.
Technical Analysis of Bitcoin Price Indicates Further Downside

Recent daily charts indicate a significant drop in Bitcoin price over the past few days. It has fallen below the 50-day moving average and formed a double-top pattern, with a neckline at $106,978, which occurred at its lowest point on September 1.
The gap between the double-top peak and the neckline is approximately 13.8%. If we project that distance from the neckline, it sets a target of $92,115.

