The BNB price has emerged as a standout in August, remaining stable while many large-cap cryptocurrencies faced market pullbacks. Recently, the Binance coin achieved a new all-time high of $899, boosting its three-month gains to nearly 30% and yearly returns to over 61%.
As of the latest update, BNB is trading around $865, reflecting an increase of more than 4% over the month and 1.7% in the past week. This strength instills confidence among buyers, but on-chain and technical indicators suggest that the next move towards $1,000 depends heavily on how the market responds to a significant price wall.
Short-Term Holder NUPL Signals Waning Profit Margins
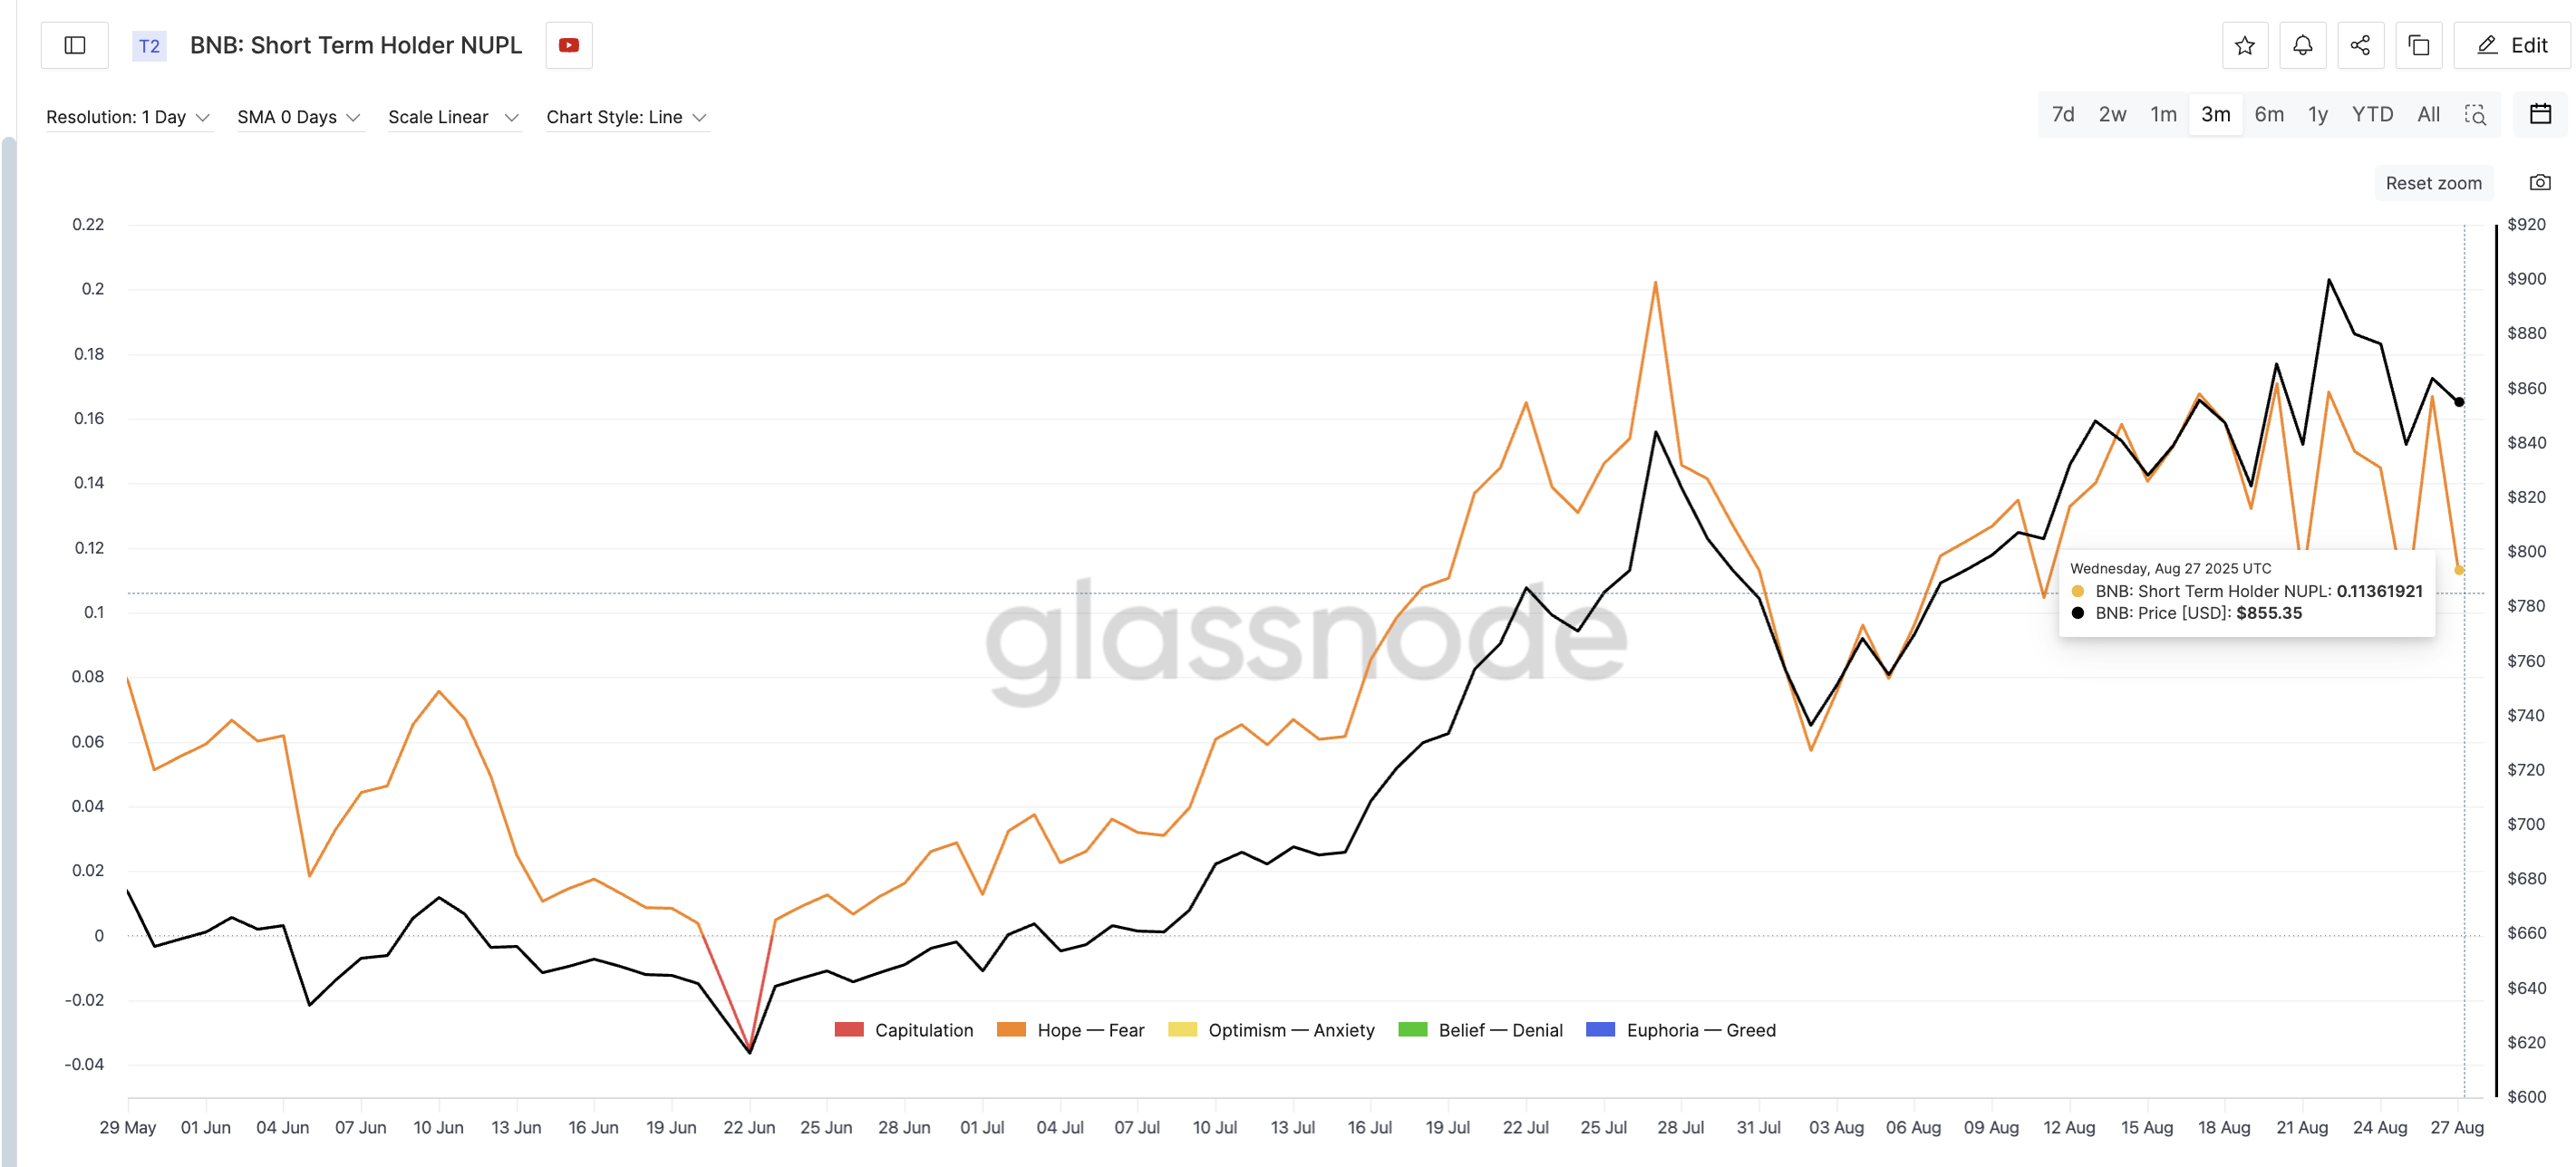
A crucial indicator of BNB’s price momentum is the Short-Term Holder Net Unrealized Profit/Loss (NUPL). This metric gauges whether short-term investors—typically those who have held coins for less than 155 days—are in profit or loss relative to their purchase price.

On August 22, when the BNB price hit $899, the short-term NUPL reached 0.16, indicating that most investors were still in profit. However, by August 27, it plummeted to 0.11, even as the price only dipped about 5% to $855.
This discrepancy indicates that profit margins for newer holders have diminished significantly compared to the price drop. In essence, fewer traders are capitalizing on substantial gains, which reduces the inclination to realize profits. This shift often leads to market stabilization, as selling pressure diminishes while buyers continue to accumulate.
For token TA and market updates: Interested in more insights on tokens? Subscribe to Editor Harsh Notariya’s Daily Crypto Newsletter here.
Hidden Bullish Divergence Points To Buyer Strength
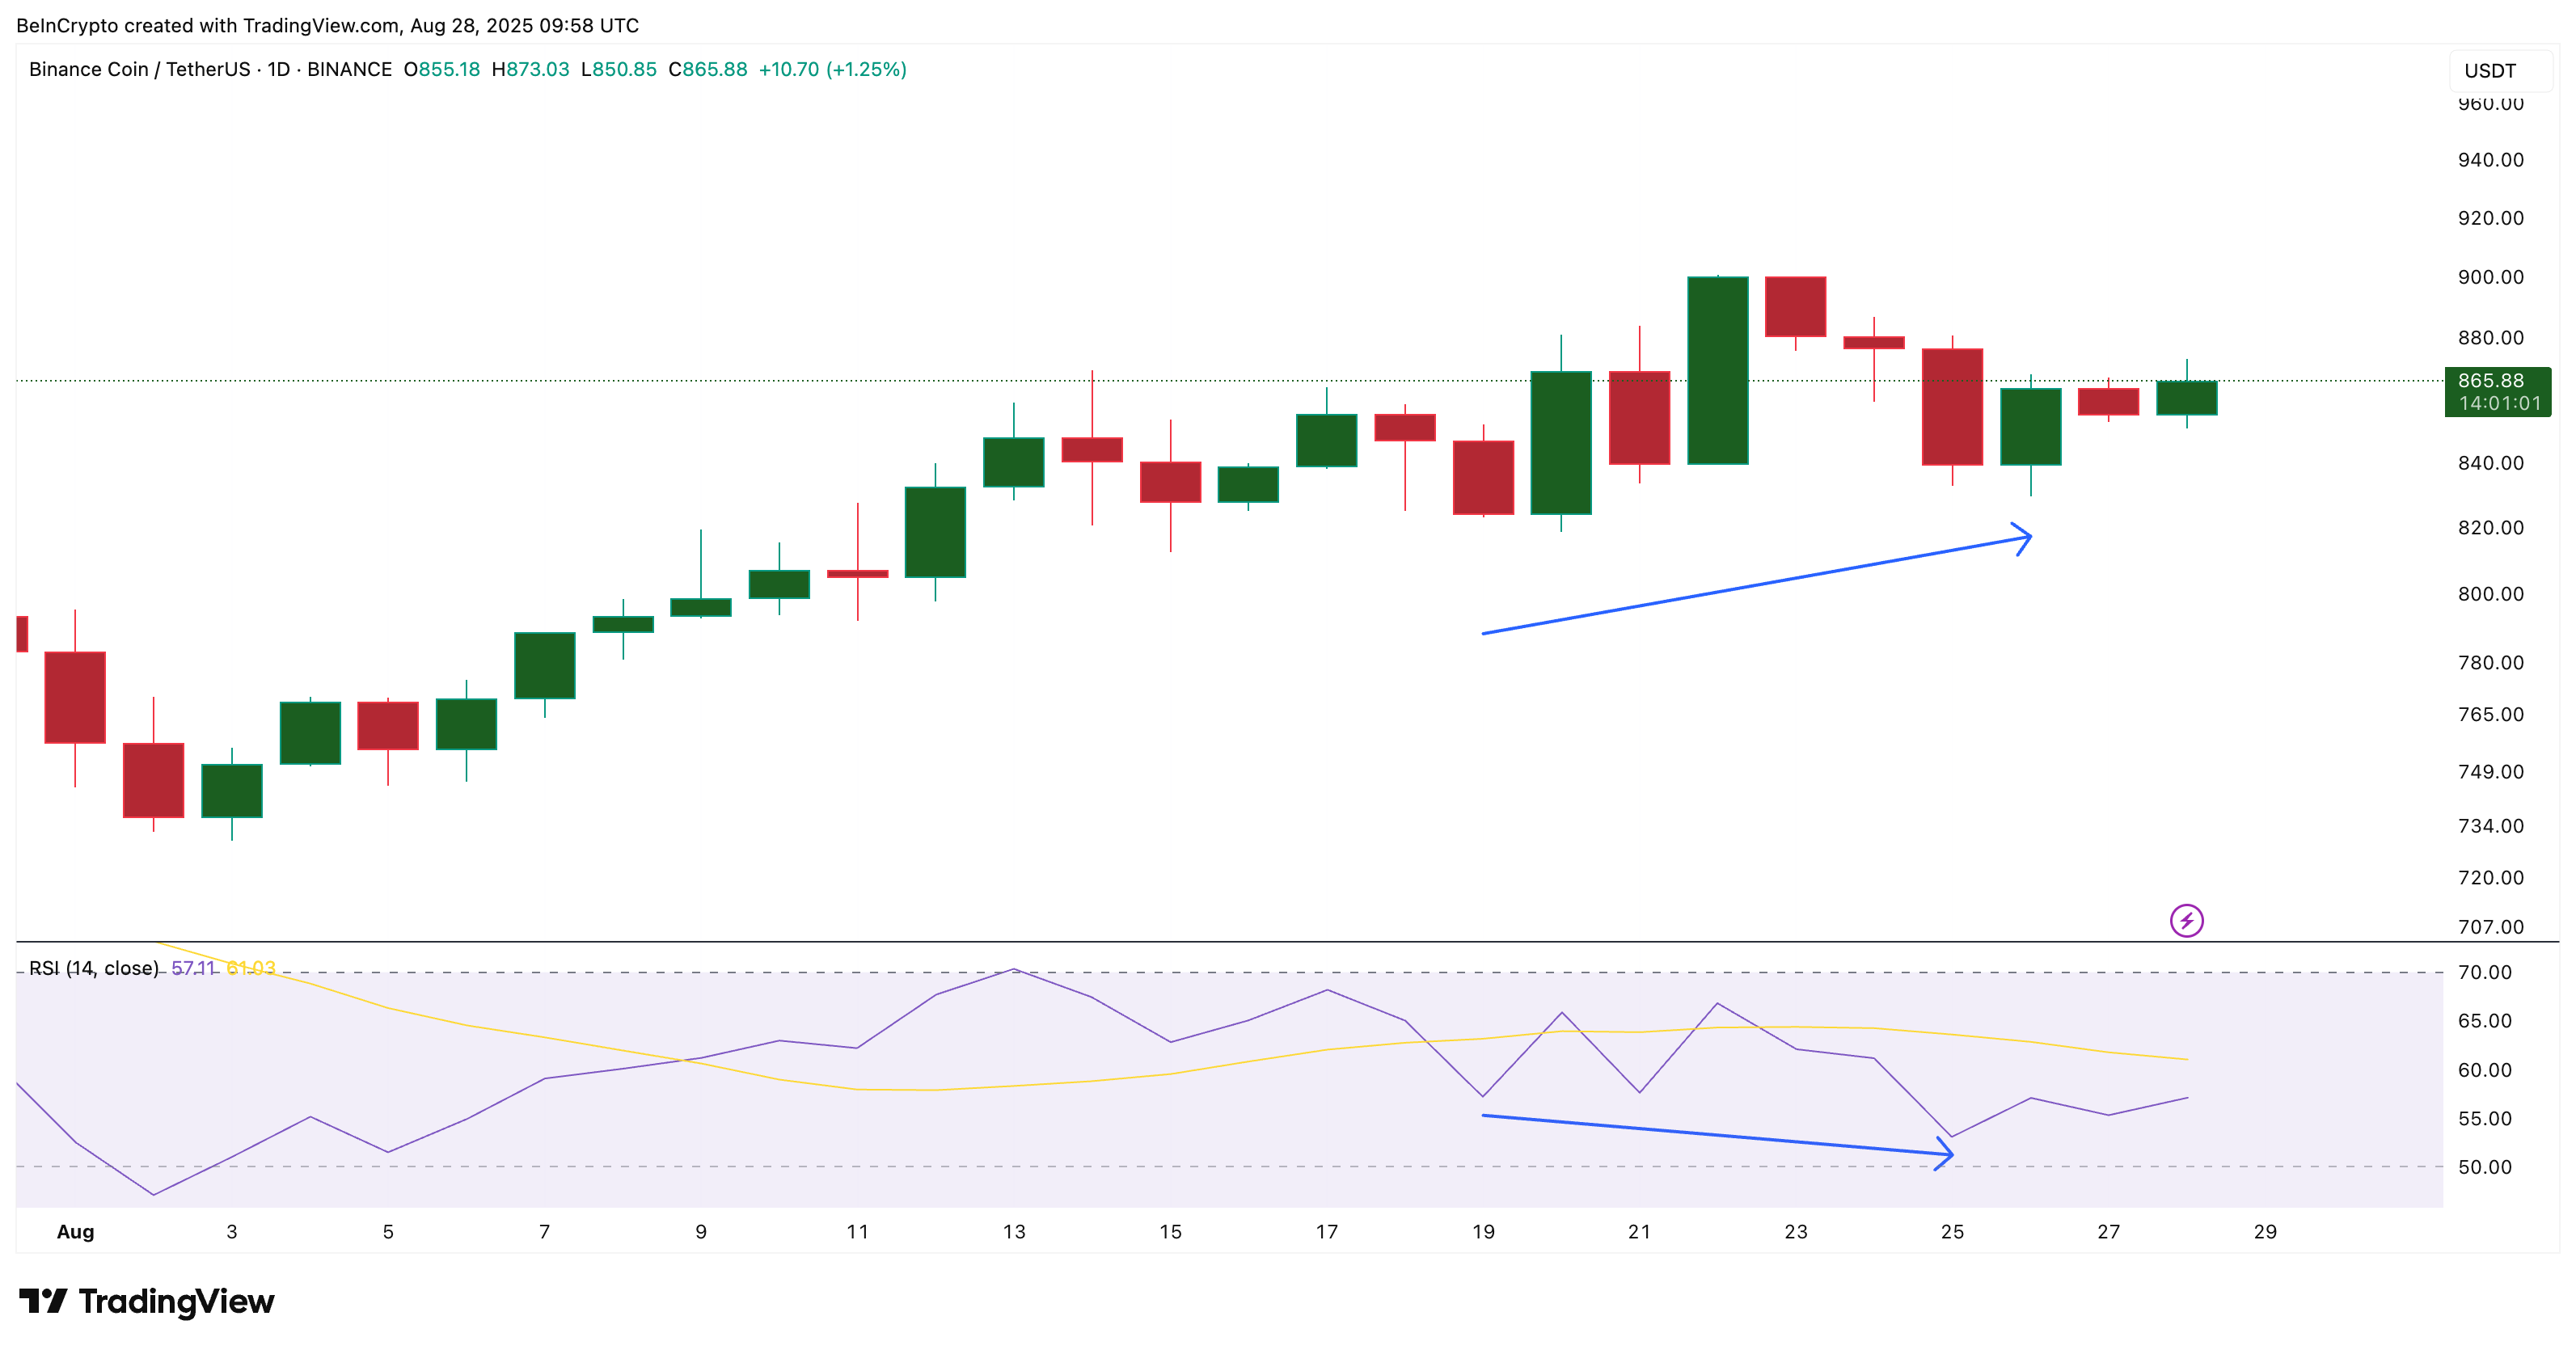
Another significant indicator is the Relative Strength Index (RSI). The RSI measures buying or selling pressure on a scale from 0 to 100.

From August 19 to August 25, BNB’s price exhibited a higher low, while the RSI recorded a lower low. This pattern, known as hidden bullish divergence, illustrates a connection between buyers and sellers. Despite diminishing momentum readings, buyers were active, preventing the BNB price from reaching deeper lows.
This type of divergence is often found in strong uptrends, indicating that sellers attempted to decrease market value but encountered fresh demand. For BNB, it suggests that the recent consolidation is not a sign of exhaustion but rather preparation for a likely continuation of the bullish trend.
Heatmap And Resistance Levels Define The Next BNB Price Move
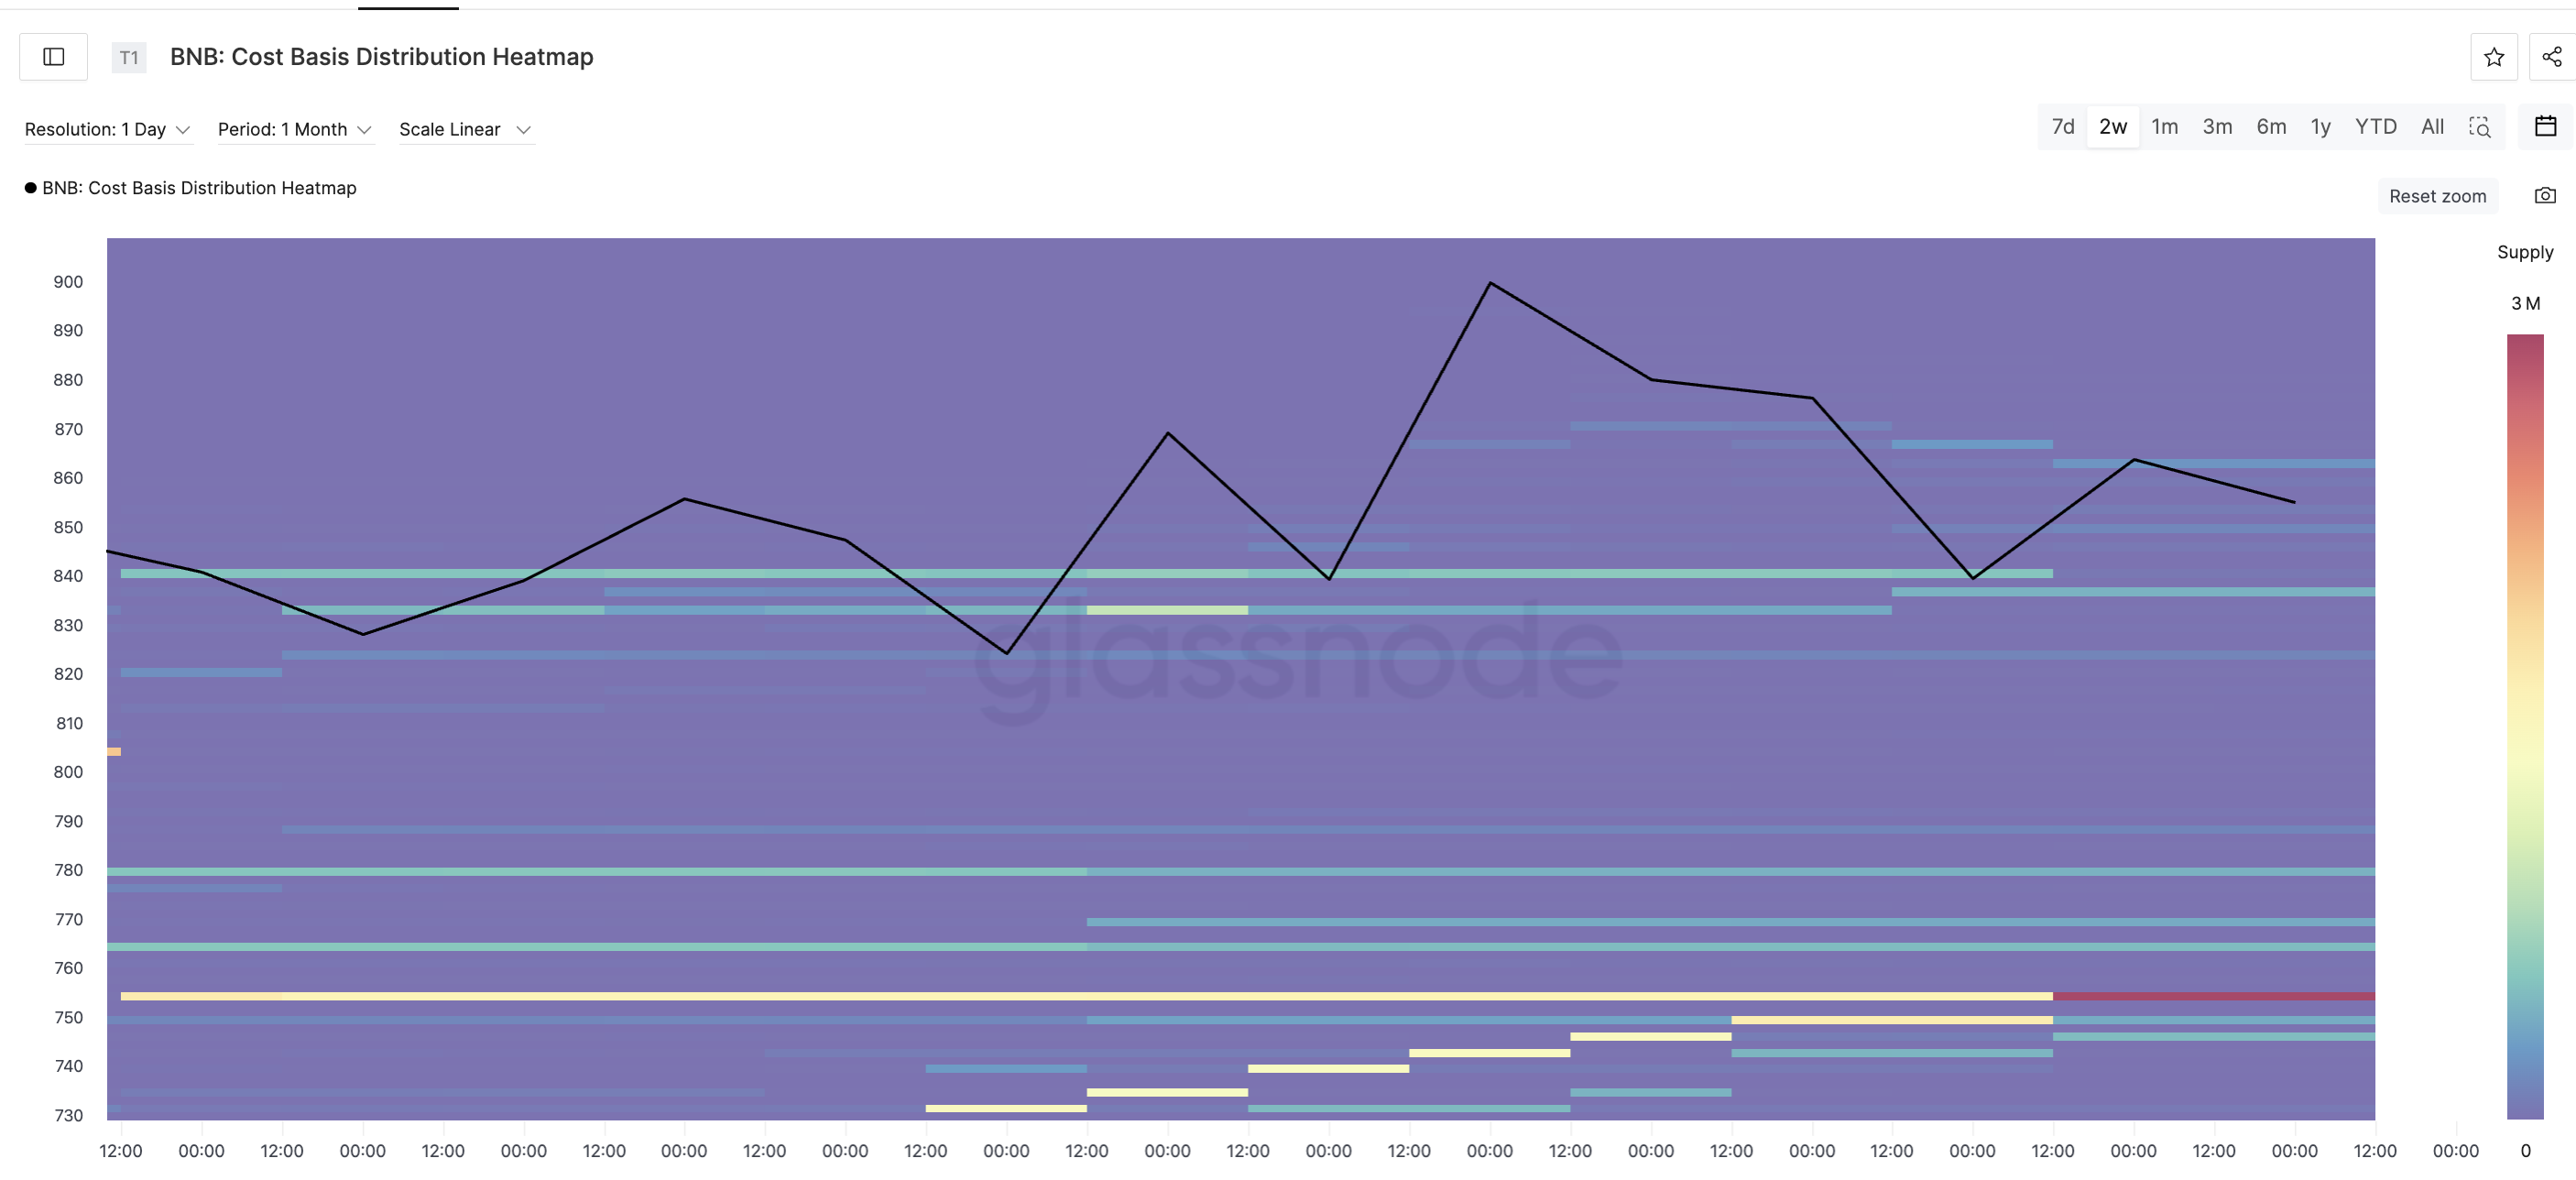
The forthcoming crucial step for Binance coin is tied to key resistance areas. A cost basis heatmap reveals where large amounts of coins were recently acquired, effectively pinpointing regions where sellers might seek to offload their assets.

According to both the heatmap and price trends, a significant wall exists in the $862–$871 range. Glassnode data indicates that 23,737 BNB are clustered between $862 and $864, alongside another 6,462 BNB between $869 and $871.

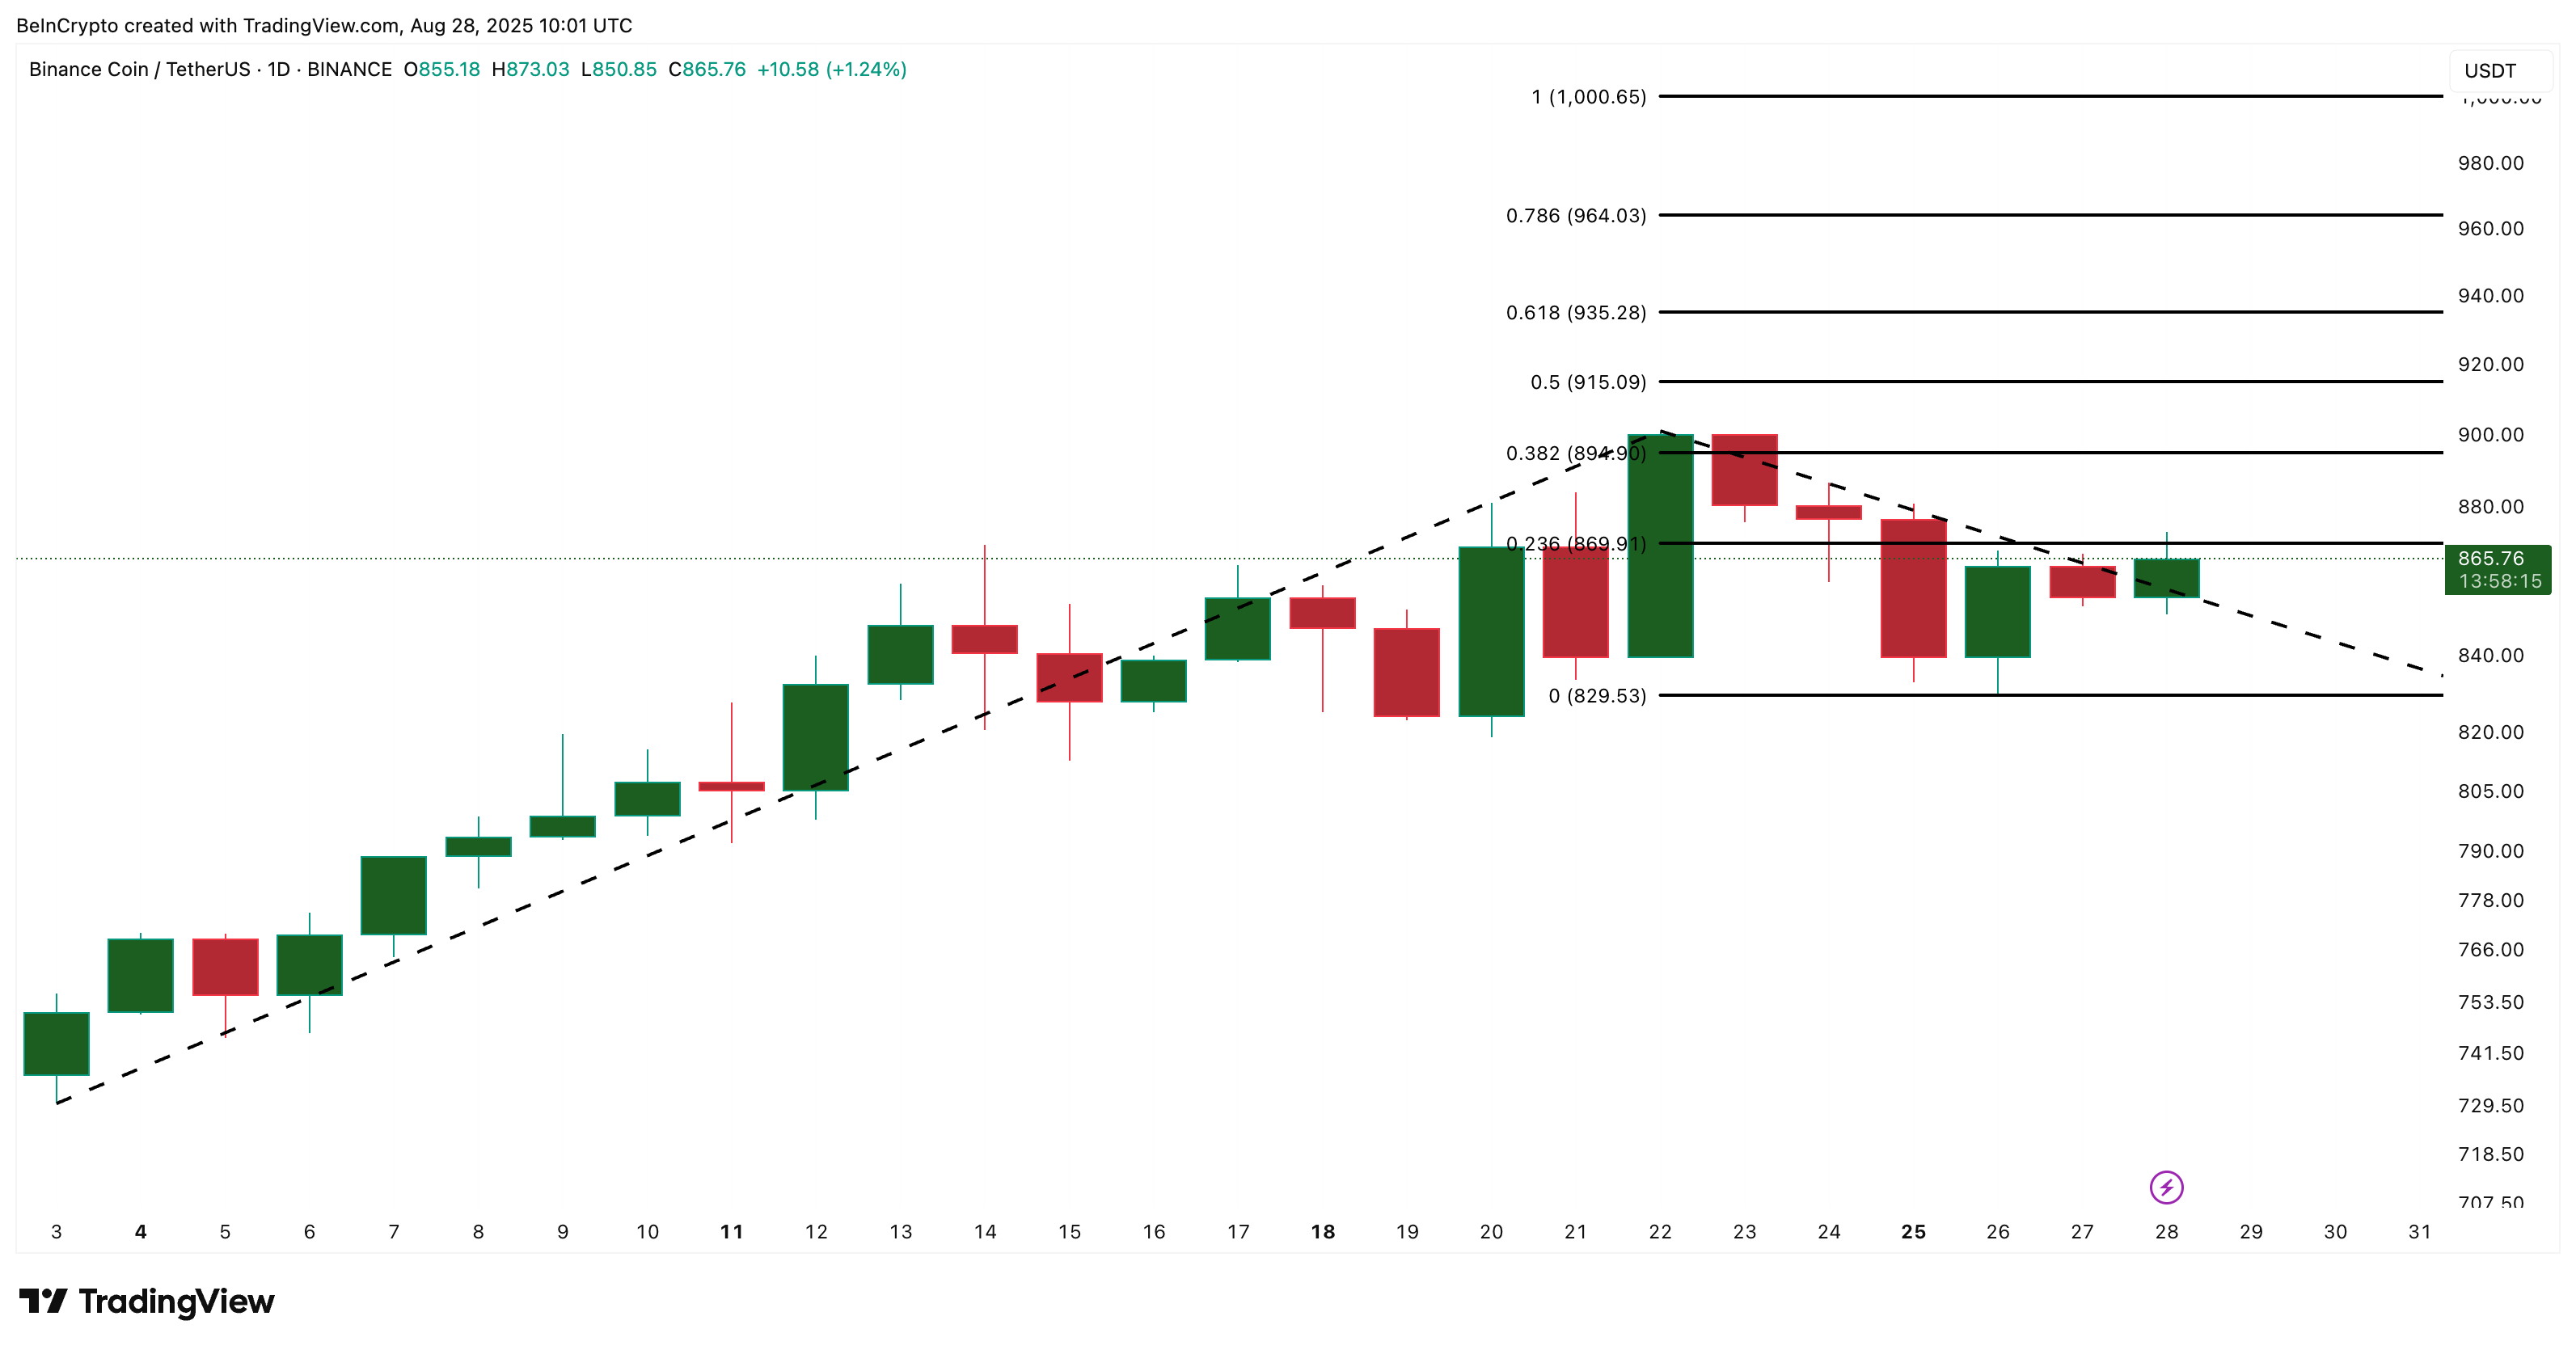
This substantial supply cluster elucidates why the BNB price has faced challenges closing above these levels after repeated attempts. Currently, the price oscillates within the $829–$869 range, and historical data shows rejections at these resistance levels.
A clear daily close above $869 would confirm a breakout, paving the way to $1,000, an essential target for BNB’s price.
A drop below $829, however, would alter the short-term outlook to bearish.
The post BNB Price Rally to $1,000 Back in Play as Hidden Bullish Divergence Appears appeared first on BeInCrypto.

