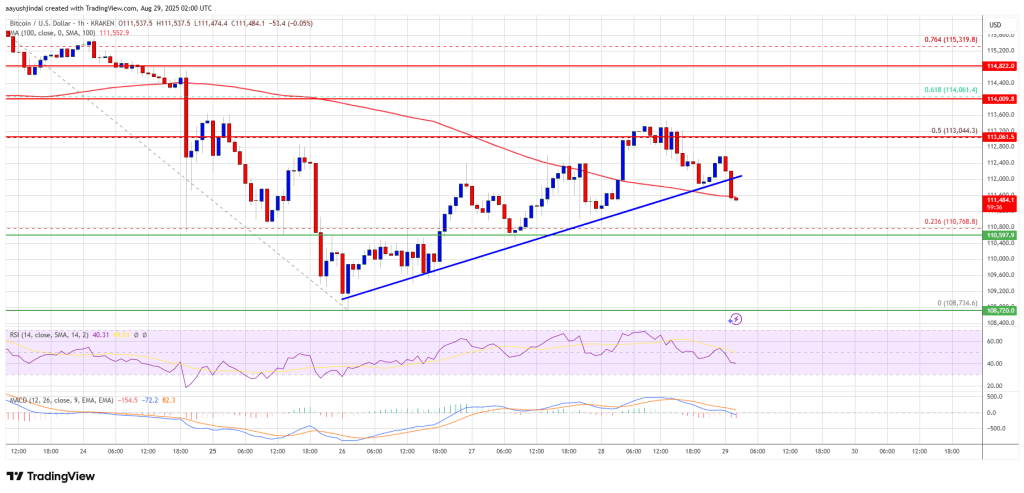
The price of Bitcoin is displaying bearish trends beneath $113,000. BTC is facing difficulties in making a recovery and may begin another drop below the $111,000 level.
- Bitcoin initiated a recovery attempt above the $109,550 threshold.
- The price is currently trading under $112,000 and the 100-hour Simple Moving Average.
- A significant break occurred below a crucial bullish trend line with support at $112,000 on the hourly chart of the BTC/USD pair (using data from Kraken).
- If it breaches the $110,750 support region, the pair may begin another decline.
Bitcoin Price Experiences Another Dip
Bitcoin’s price made a bid for recovery from the $108,734 low. BTC successfully ascended above both the $109,500 and $110,000 resistance levels.
The price moved past the 23.6% Fibonacci retracement level of the notable drop from the $117,355 swing high to the $110,734 low. The bulls even managed to push the price above the $112,500 resistance zone. However, it faced challenges staying above the $113,000 resistance.
The pullback occurred from the 50% Fibonacci level of the significant decline from the $117,355 swing high to the $110,734 low. Additionally, there was a noticeable drop below a crucial bullish trend line with support at $112,000 on the hourly chart of the BTC/USD pair.
Currently, Bitcoin is trading below $112,000 and the 100-hour Simple Moving Average. Immediate resistance can be found near the $112,400 level, while the first major resistance lies around the $113,000 mark. The subsequent resistance may reach $113,500.

A close above the $113,500 resistance might propel the price higher. In that scenario, it could test the $114,000 resistance level. Further gains could see the price approach the $115,500 level, with the primary target being $116,500.
Are Further Losses Ahead for BTC?
If Bitcoin does not overcome the $113,000 resistance level, it may trigger a new decline. Immediate support is located around the $110,750 level, and the first major support is near $110,000.
The next support level lies around the $109,500 zone. Additional losses could drive the price toward the $108,500 support in the near term. The main support level is at $106,500, below which BTC may decline sharply.
Technical indicators:
Hourly MACD – The MACD is currently picking up speed in the bearish zone.
Hourly RSI (Relative Strength Index) – The RSI for BTC/USD is below the 50 barrier.
Major Support Levels – $110,750 and subsequently $109,500.
Major Resistance Levels – $112,500 and $113,000.

