Bitcoin is once again facing significant pressure, retracing towards the $103,000 mark as the overall cryptocurrency market experiences a sharp decline. After several days filled with volatility and unsuccessful recovery attempts, BTC has breached essential support levels, heightening fear and accelerating sell-offs across altcoins. Many major assets are reflecting substantial losses, leading traders and investors to question if the market has entered a prolonged corrective phase.
Related Reading
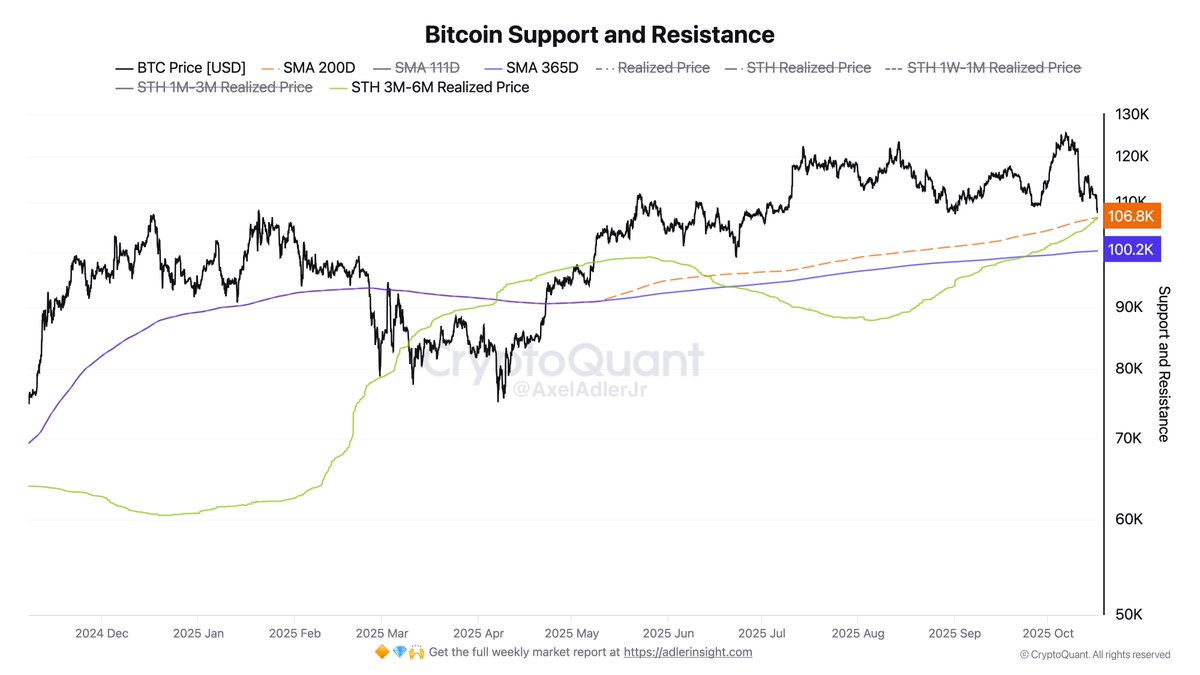
Top analyst Axel Adler notes that Bitcoin’s primary support zone exists in the $106,000 to $107,000 range, characterized by the Short-Term Holder (STH) 1M–3M Realized Price and the 200-day simple moving average (SMA 200D). This vital area marks a convergence of both on-chain and technical support levels where previous corrections have historically found stability.
However, the current trend indicates growing weakness. Panic is spreading, and liquidity is diminishing, with the focus now on the $106K–107K range — a pivotal battleground that could shape Bitcoin’s short-term direction and influence the entire crypto market.
Bitcoin’s Market Structure Faces a Crucial Test
Adler emphasizes that a drop below the $106K level could lead to a decline towards $100,000, where the yearly moving average (SMA 365D) aligns — a level historically known to act as a springboard for significant reversals during earlier market cycles.

Despite increasing anxiety, Adler points out that the macro structure remains bullish as long as the $100K level holds. This region denotes long-term buyer interest, and defending it could alleviate excessive leverage and pave the way for a more stable recovery. However, with Bitcoin currently trading below the $106K mark, concerns are rising that the market might be gearing up for a more profound test of this essential support.
Analysts are now vigilantly monitoring the daily candle closes to determine whether the move below support is simply a liquidity sweep or a confirmation of a bearish trend. If Bitcoin fails to reclaim the $107K level promptly, a broader shift in sentiment could occur — potentially extending the consolidation phase and challenging investor confidence.
Conversely, a robust bounce back from the $100K area would lend credence to the idea that the correction is part of a healthy reset within an ongoing bull market. The upcoming days will thus be critical: either Bitcoin maintains this support and regains momentum, or it breaks lower, indicating that the current cycle’s most intense volatility phase is not yet concluded.
Related Reading
Bitcoin Tests Support Zone Amid Continued Weakness
Bitcoin continues its downward trend, with recent charts displaying price action around $106,000, now probing one of the most significant support zones in recent months. Following unsuccessful attempts to reclaim the resistance levels at $115,000 and $117,500 earlier this week, BTC extended its losses, briefly hitting an intraday low near $103,500 before experiencing a slight recovery. The market remains tense as traders monitor whether the 200-day moving average (SMA 200D) — presently around $107,500 — will hold.

This level is significant as it represents the Short-Term Holder (STH) realized price region, aligning with the area analysts deem as a major structural base. A confirmed breakdown beneath it could lead to a test of $100,000, where the yearly moving average (SMA 365D) corresponds, serving as the next significant support level.
Related Reading
Momentum indicators indicate that BTC is still experiencing considerable bearish pressure. The 50-day and 100-day moving averages are on a downward trend, reflecting a loss of short-term momentum. Unless Bitcoin can manage to close daily candles above $107K, market sentiment is likely to remain cautious.
Featured image from ChatGPT, chart from TradingView.com

