Quick Highlights
- Shiba Inu (SHIB) is currently trading between $0.00001000 and $0.00001250, with a possible breakout aimed at $0.00003296 and $0.00005589.
- Pepe (PEPE) is creating a symmetrical triangle pattern, suggesting a breakout towards the $0.00001800-$0.00002000 range.
- Both cryptocurrencies are experiencing significant accumulation, driven by SHIB’s burn activity and PEPE’s liquidity, which enhance rally forecasts.
Calm Before the Storm? SHIB Targets $0.00003296, PEPE Eyes $0.00002000
Shiba Inu (SHIB) and Pepe (PEPE) are back in the spotlight, with analysts noting that the tightening consolidation patterns might precede explosive breakouts. Investors, after weeks of stagnant trading, are questioning whether these popular meme coins are gearing up for a significant move.
Market analysis indicates that both tokens are positioned at crucial levels where accumulation zones and chart formations could spark sharp uptrends.
Shiba Inu’s Accumulation Heating Up
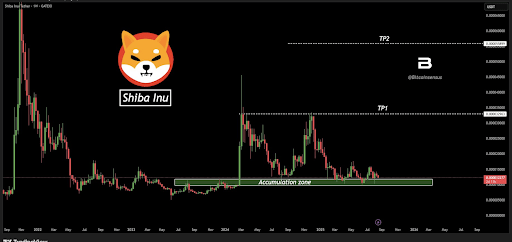
According to Bitcoinsensus, SHIB remains ensconced in a designated accumulation range, with solid support between $0.00001000 and $0.00001250. Historically, Shiba Inu has exhibited a propensity for sharp rallies following extended consolidation periods.
Analysts point out that the primary resistance is around $0.00003296, identified as Take Profit 1 (TP1). A successful breakout at this point could propel momentum toward $0.00005589, targeting Take Profit 2 (TP2).
Recent trading activity signals renewed interest in the token. At present, Shiba Inu is trading at $0.00001316, reflecting a 1.7% increase in the last 24 hours and nearly 2% overall. With a market capitalization of $7.78 billion and a circulating supply surpassing 584 trillion SHIB, the token demonstrates strength in holding its long-term support levels.
Additionally, burn activity persists, with over 79,000 tokens destroyed in the past 24 hours. This ongoing supply decrease, while minimal relative to the vast circulating amount, adds a gradual bullish element for long-term holders.
Pepe’s Symmetrical Triangle Points to a Breakout
On another front, Pepe (PEPE) is also signaling a potential uptrend. CryptoJack observes that PEPE/USDT is contracting in a symmetrical triangle on the daily chart, with prices narrowing between the $0.00001000 support and the $0.00001450 resistance. This pattern typically heralds breakouts, and any upward momentum could lead PEPE to a price range of $0.00001800-$0.00002000 contingent on breaking through resistance.
AltCryptoGems further highlights that PEPE has maintained a broad trading range since March, between $0.00000070 and $0.00000170. Currently consolidating around the midpoint at $0.00000110, the token is compressing into a flag pattern. The outcome of this flag’s resolution may significantly influence the token’s trajectory in the upcoming weeks, determining whether it will reach the range’s highs or risk reverting to the lows.
According to data from Coingecko, PEPE is currently priced at $0.00001128, posting a daily increase of 10.91% and a weekly rise of 4.51%. With a market cap of $4.76 billion and a daily trading volume exceeding $1.45 billion, substantial liquidity is fueling speculation.


