A number of investors are currently interpreting bitcoin as nearing the end of its market cycle, implying that Q4 may signify the conclusion of this phase. Nonetheless, two important indicators suggest that the bull market might still just be beginning.
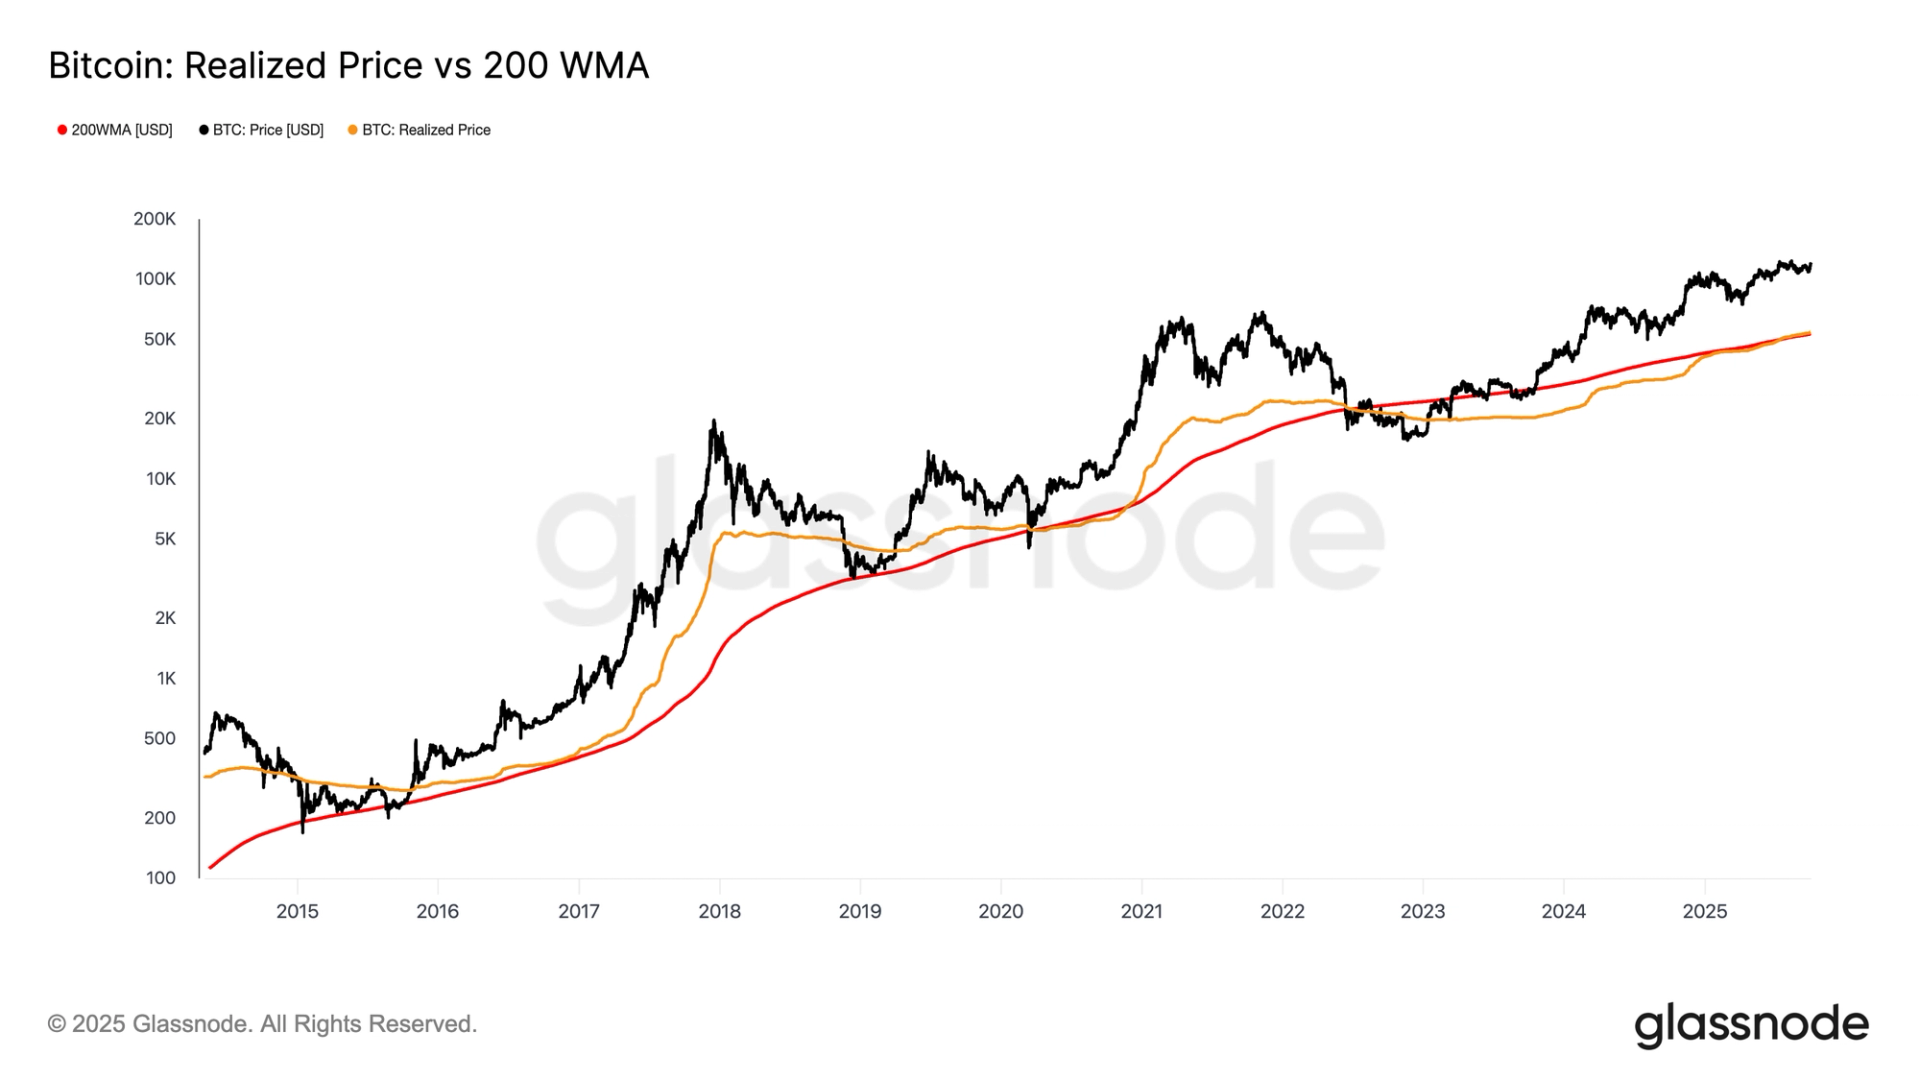
According to Glassnode data, the 200-week moving average (200WMA), which represents a long-term price trend for bitcoin and has historically moved upwards, has recently surpassed $53,000.
Additionally, the realized price, or the average price at which each bitcoin in circulation has last been transferred on-chain, has climbed above the 200-WMA, now standing at $54,000.
Examining past market cycles reveals a recurring trend. In bullish markets, the realized price consistently stays above the 200-WMA, while in bearish markets, the reverse holds true.
For instance, during the bull markets of 2017 and 2021, the realized price steadily increased and expanded its gap over the 200-WMA, ultimately falling below it and indicating the onset of bearish conditions.
During the downturn in 2022, the realized price dipped below the 200-WMA but has just recently recovered above it. Historically, once the realized price remains above this key moving average, bitcoin usually experiences upward momentum as the bull market advances.

