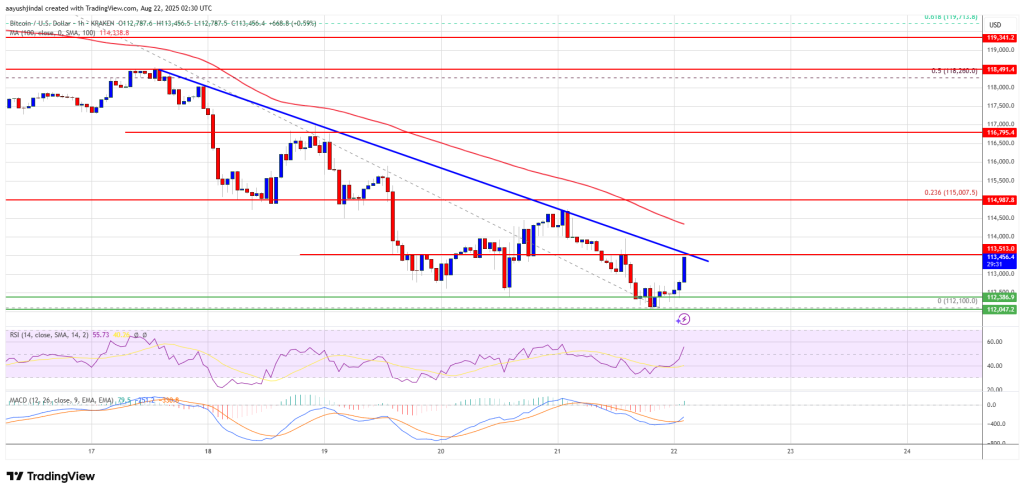
The price of Bitcoin is attempting to bounce back from $112,000. BTC has climbed back above $113,200, but it encounters several obstacles on the way to $118,000.
- Bitcoin has initiated a recovery wave above the $112,500 mark.
- The price is trading below $115,000 and the 100-hour Simple Moving Average.
- A significant bearish trend line is forming with resistance at $113,500 on the hourly chart of the BTC/USD pair (data feed from Kraken).
- The pair may begin another upward move if it surpasses the $115,000 resistance zone.
Resistance for Bitcoin Price
The price of Bitcoin faced a new decline after closing below the $115,000 threshold. BTC gained bearish momentum and traded under the $113,200 support zone.
It dipped below the $112,500 support range and the 100-hour Simple Moving Average. The pair tested the $112,000 mark, hitting a low of $112,100, and is now attempting to recover towards the 23.6% Fibonacci retracement level from the recent drop between the $124,420 swing high and the $112,100 low.
Bitcoin is currently trading below $114,000 and the 100-hour Simple Moving Average. Immediate resistance on the upside is around the $113,500 level. Additionally, there is a key bearish trend line indicating resistance at $113,500 on the hourly BTC/USD chart.

The primary resistance is near the $114,500 level, and the subsequent resistance could be at $115,000. A close above this threshold may propel the price higher, potentially testing the $116,500 resistance level. Further gains could push the price towards $118,200, which is close to the 50% Fibonacci retracement level of the recent decline. The main target might be $120,000.
Is More Downside Possible for BTC?
If Bitcoin cannot break above the $114,500 resistance zone, it could initiate a new decline. Immediate support is situated around the $112,500 level, with major support near $112,000.
Further support lies around the $110,500 zone. Any additional losses might lead the price to the $108,250 support in the near term, with the main support at $105,500; dropping below this level could result in significant consequences for BTC.
Technical Indicators:
Hourly MACD – The MACD is currently losing momentum in the bearish zone.
Hourly RSI (Relative Strength Index) – The RSI for BTC/USD is now positioned above the 50 mark.
Major Support Levels – $112,500 and then $112,000.
Major Resistance Levels – $113,500 and $115,000.
