Stellar (XLM) has retraced significantly after a robust performance earlier this year. The token has decreased by 16.1% in the past month, falling 8.2% this week and losing another 1.7% in the last 12 hours. While yearly gains remain around 300%, multiple bearish indicators suggest that sellers might have further room to act.
For long-term holders, the next few sessions could determine whether Stellar can maintain support or experiences a significant correction.
Derivatives Weakness Cuts Support
One of the initial warnings stems from the derivatives market. Open interest, which measures the value of active futures contracts, reveals the degree of leverage behind a price movement. High open interest allows traders to significantly impact prices in either direction, frequently leading to squeezes.

On July 18, Stellar’s open interest peaked at $588.53 million as the XLM price surged. This accumulation of leverage contributed to the uptick, with short squeezes adding momentum. Since then, open interest has declined to $306.22 million—a drop of nearly 50%.
With fewer contracts available, the likelihood of another rally driven by squeezes diminishes, leaving the market more vulnerable to selling pressure.
For token TA and market updates: Want more token insights like this? Sign up for Editor Harsh Notariya’s Daily Crypto Newsletter here.
Bearish Crossover(s) Build Pressure
Spot momentum has also shifted to a negative outlook on shorter timeframes, which often indicate early trend changes.

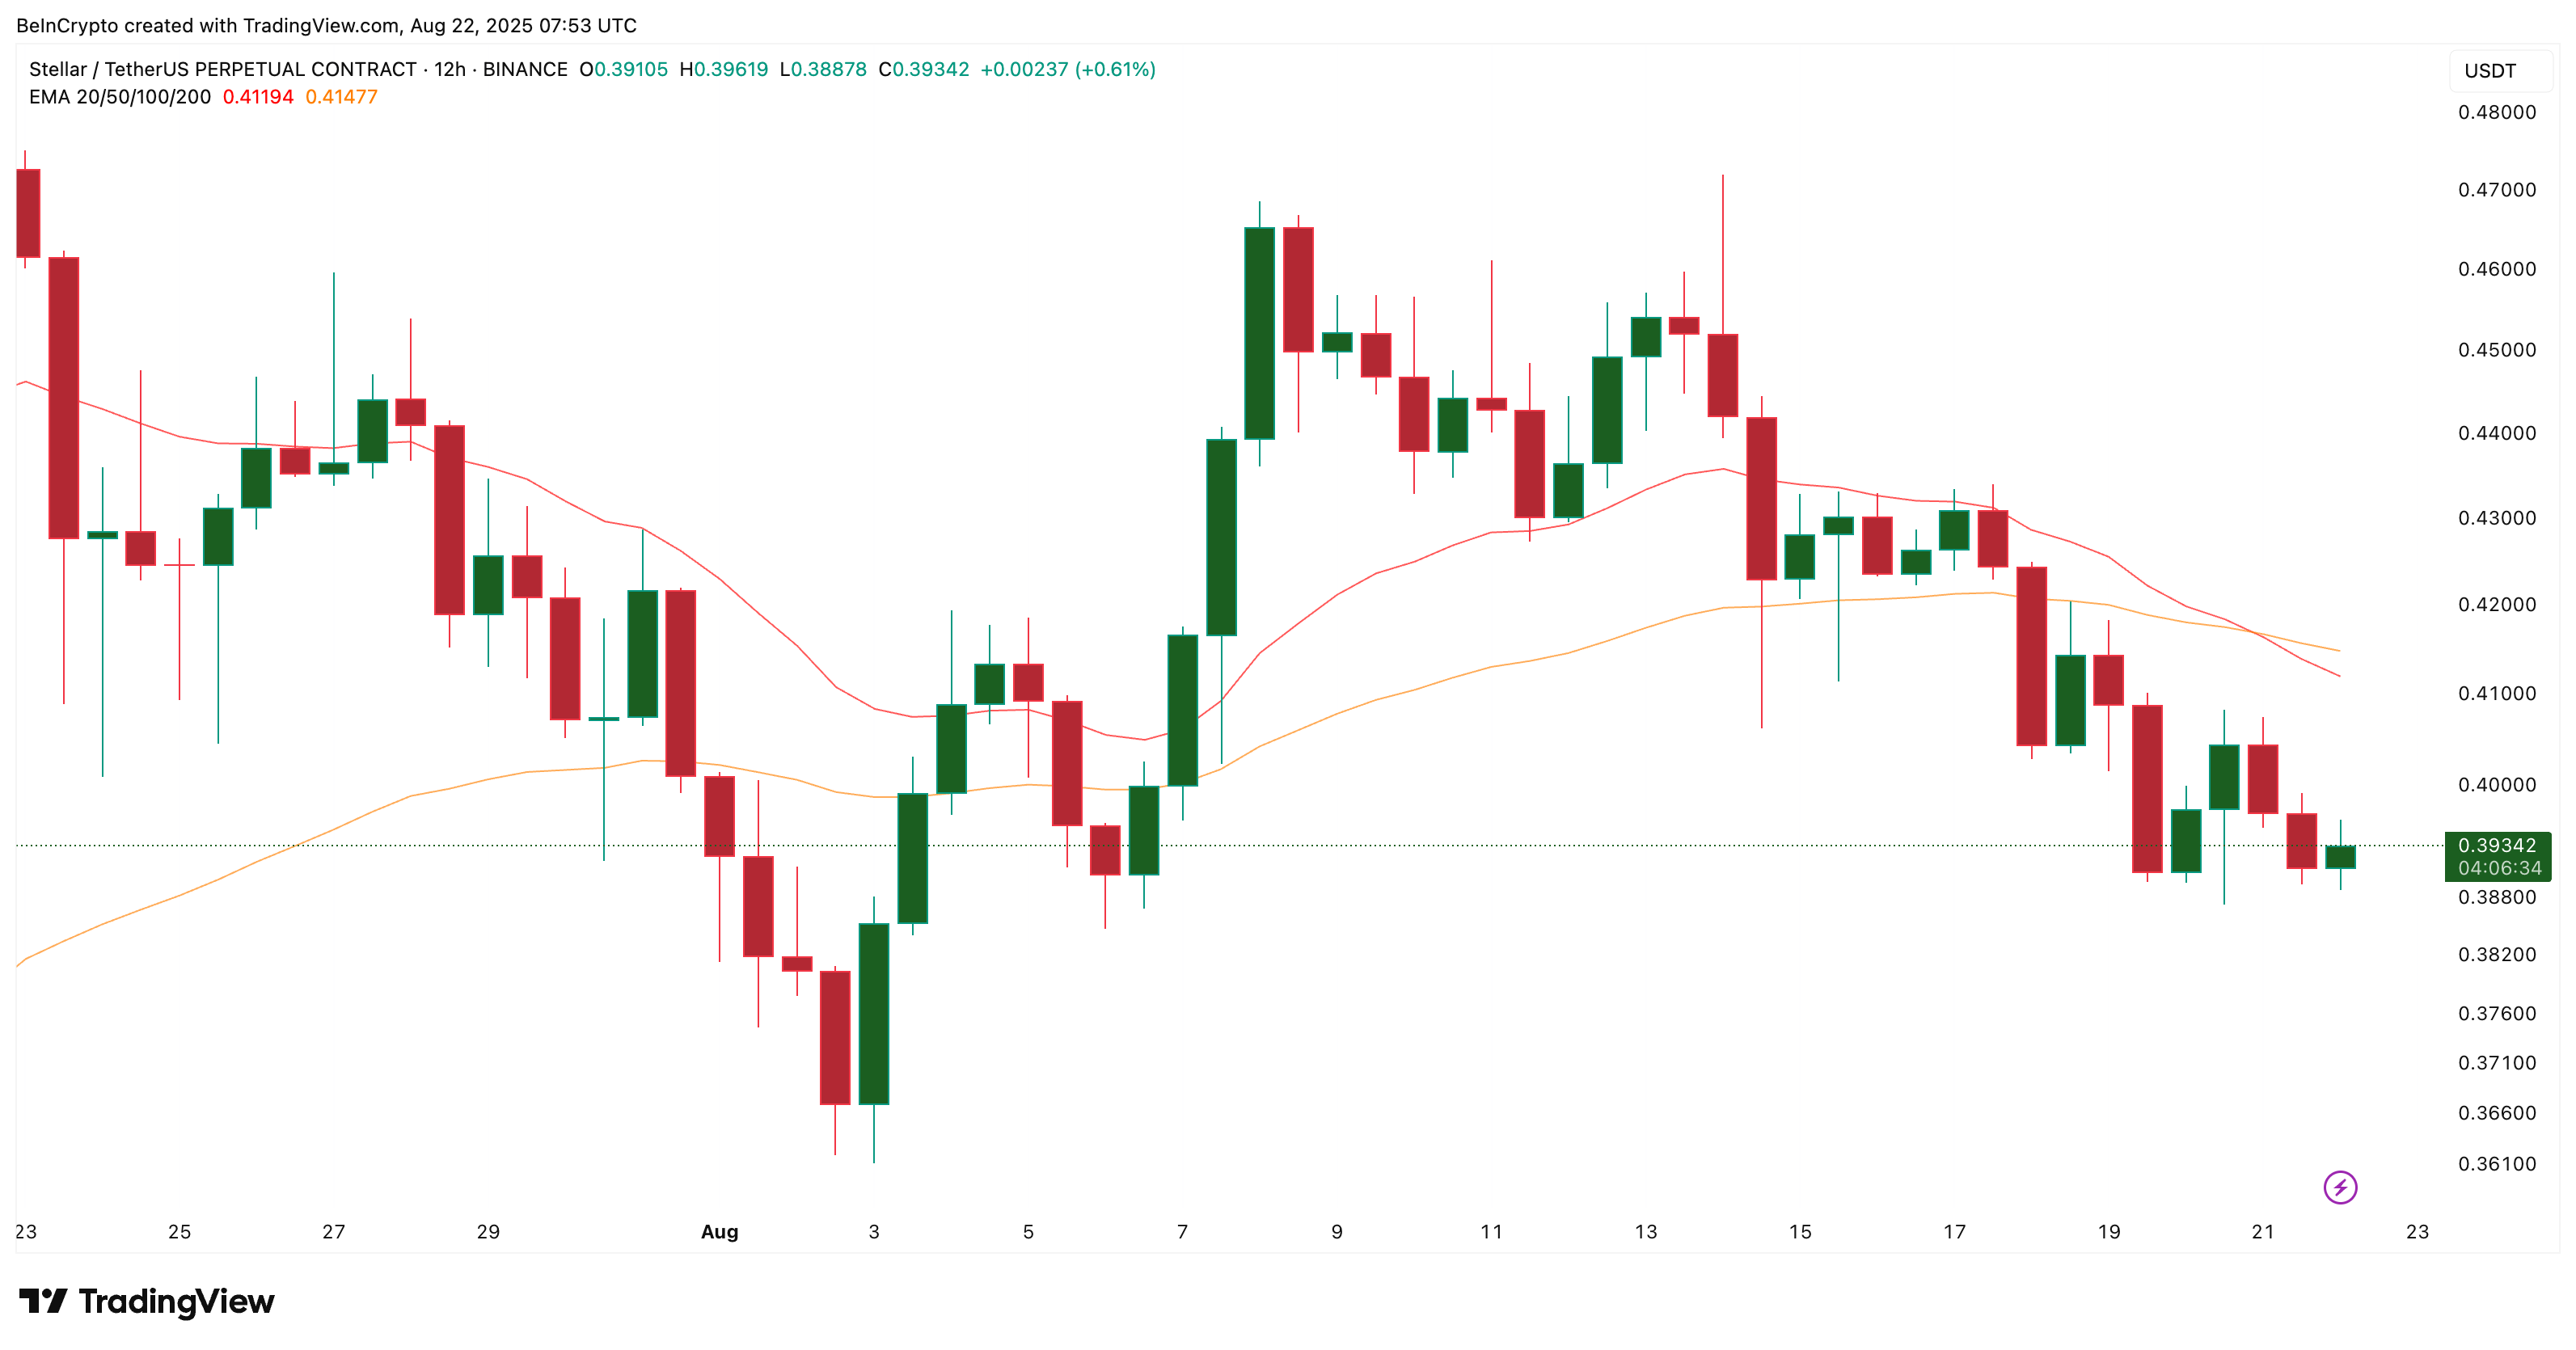
On the 12-hour Stellar price chart, the 20 EMA (Exponential Moving Average) has crossed below the 50 EMA, indicating a bearish signal and suggesting short-term control by sellers.

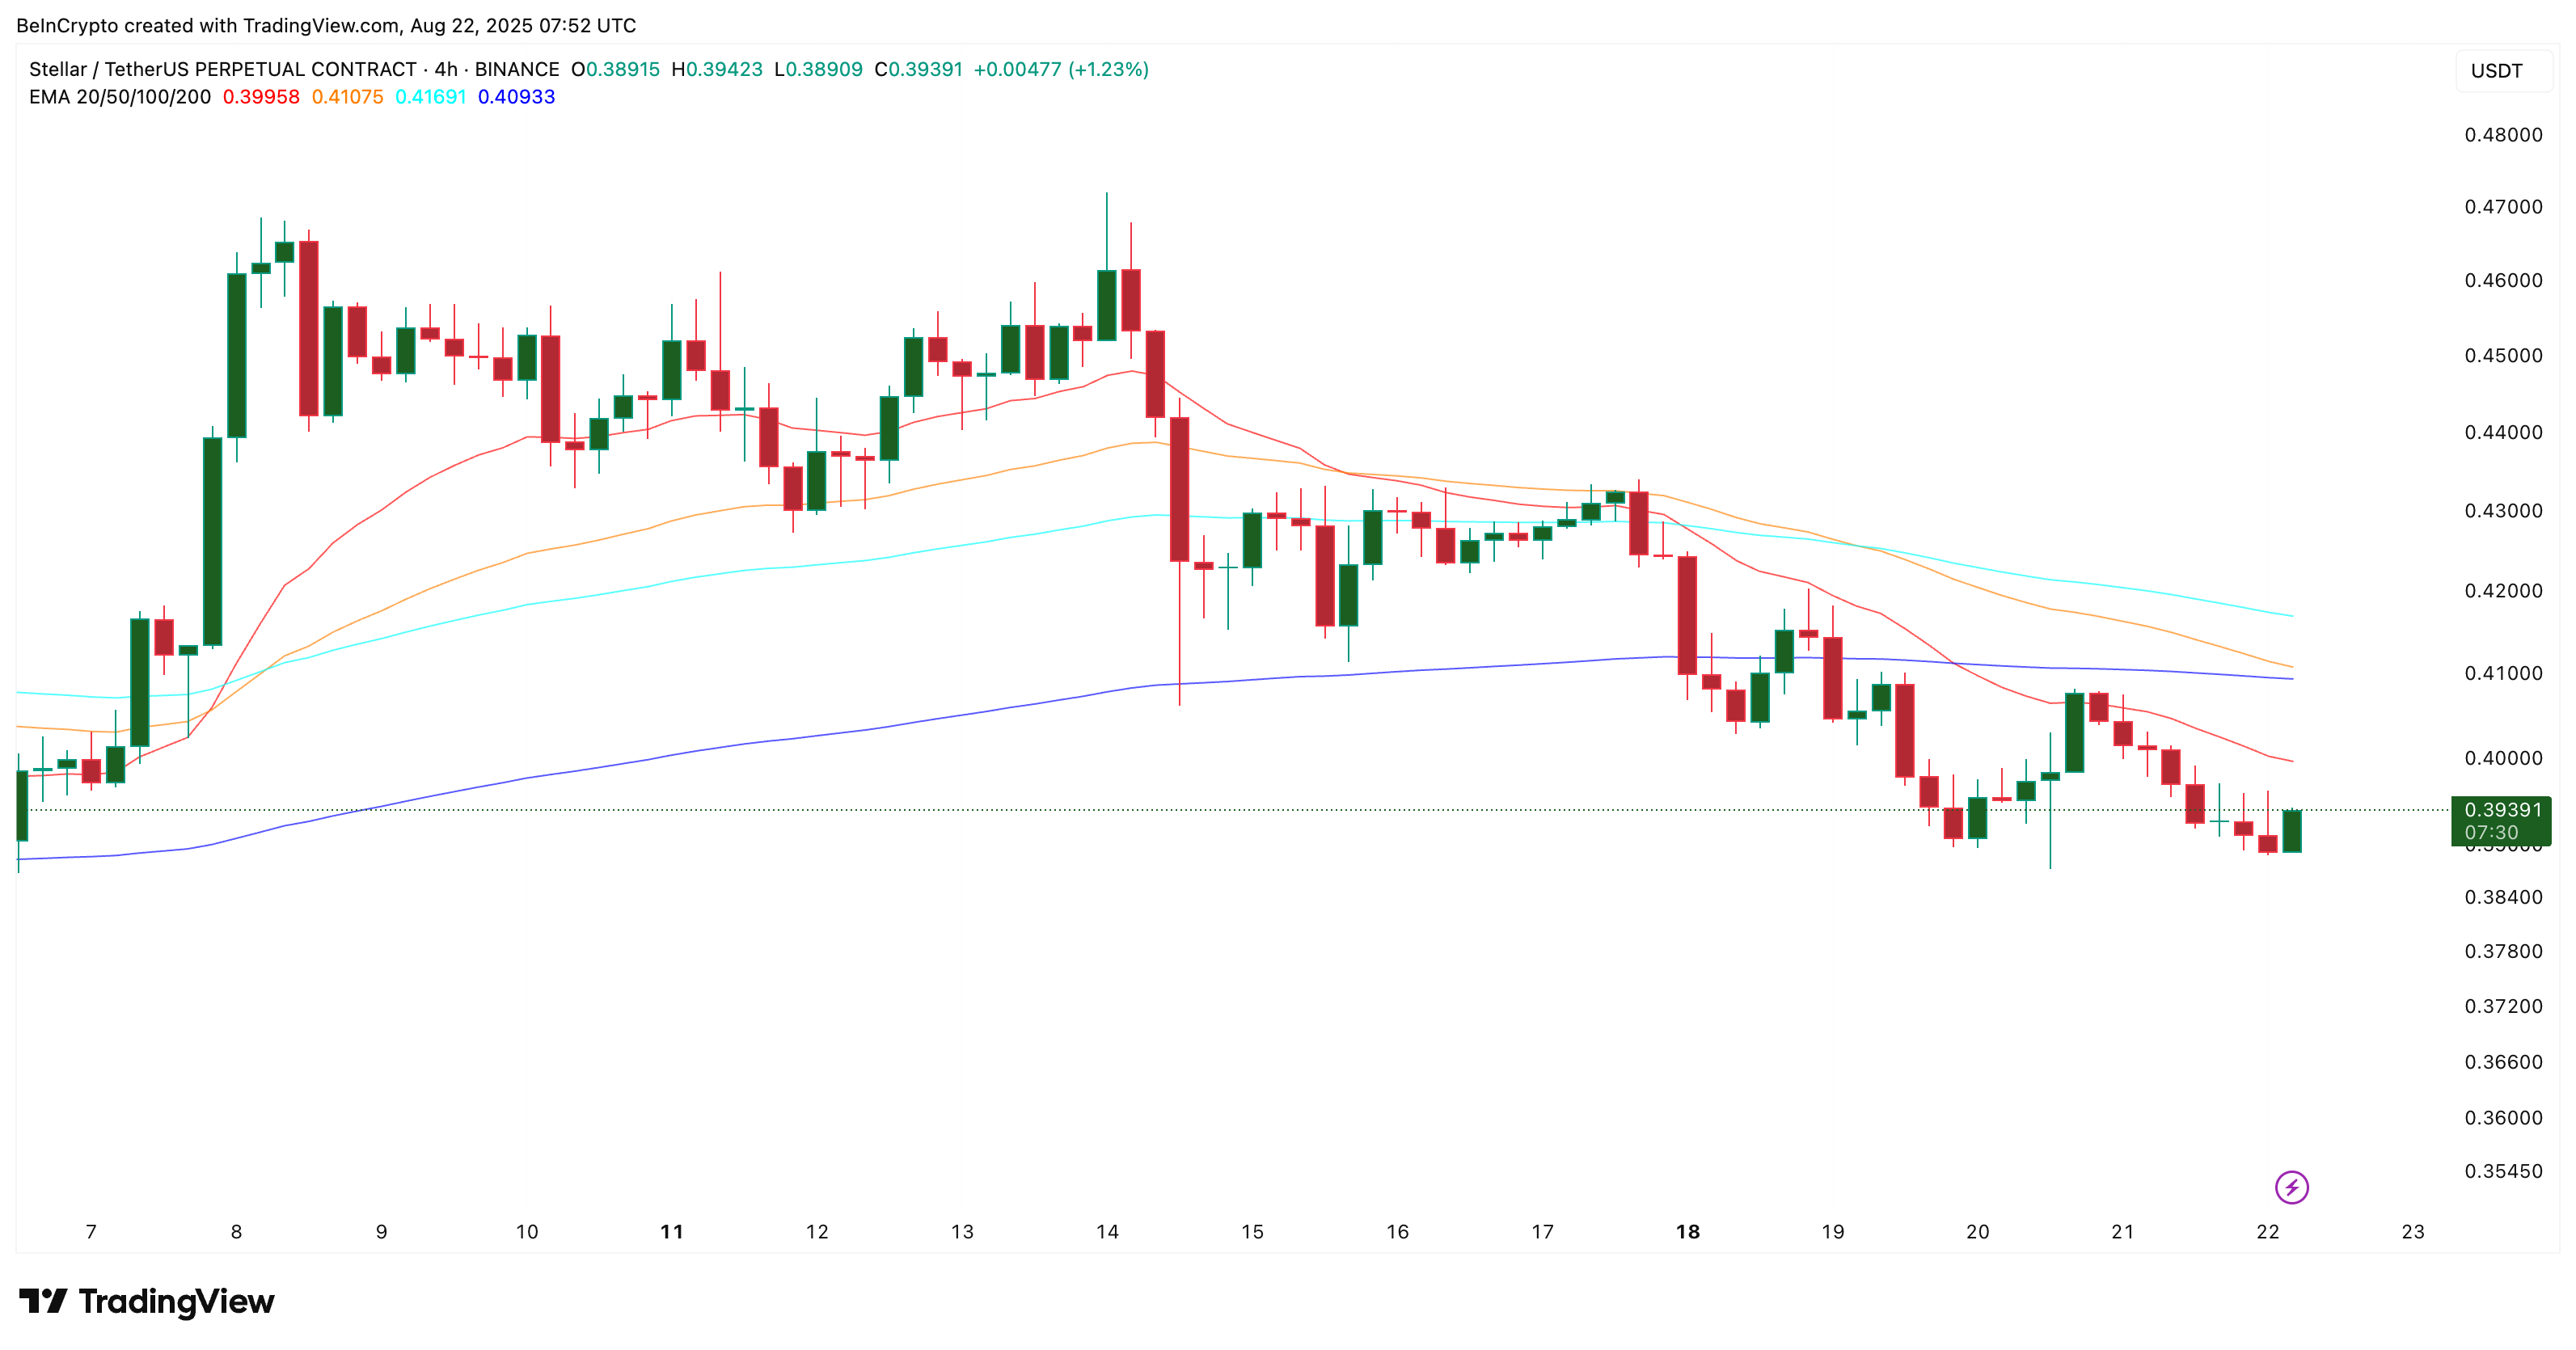
On the 4-hour Stellar price chart, the 50 EMA is nearing a crossover below the 200 EMA. A similar crossover earlier in the month preceded a decline. If confirmed, this would further increase selling pressure and reinforce the bearish outlook.
The Exponential Moving Average (EMA) gives more significance to recent prices, reacting faster than a simple average. A bearish crossover occurs when a shorter EMA/MA drops below a longer one, indicating momentum for sellers.
Triangle Pattern Points to Stellar Price Breakdown Risk
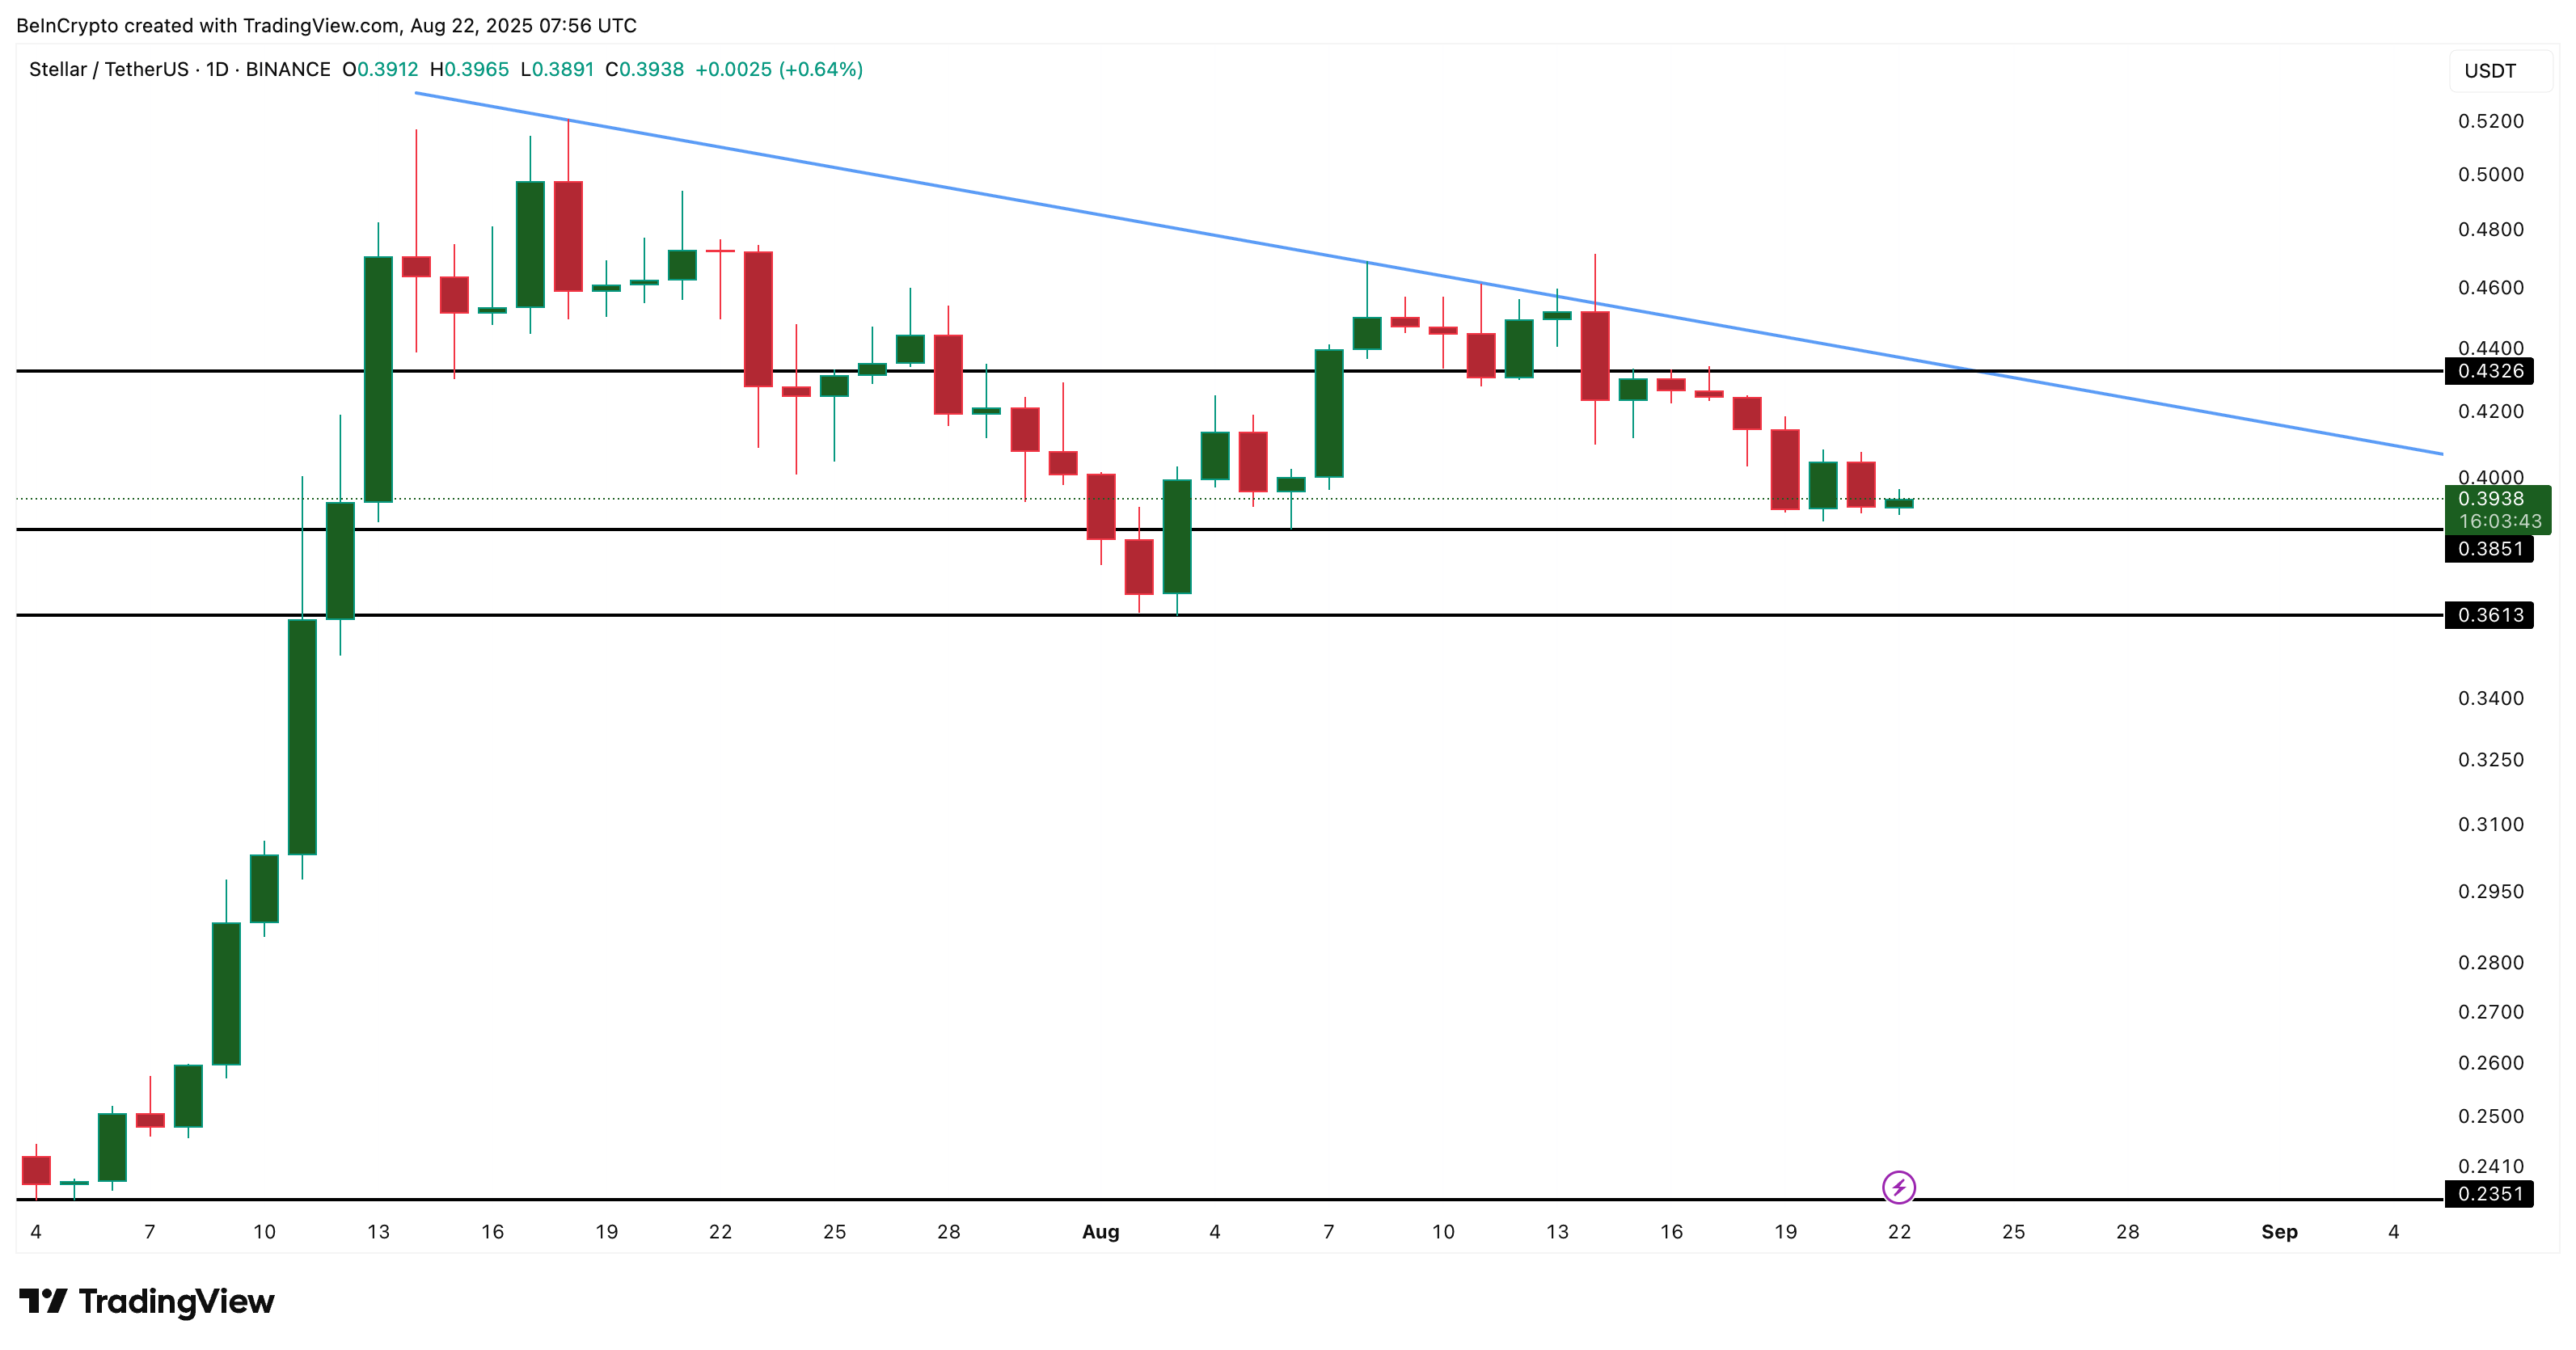
On the daily Stellar price chart, XLM is trading within a descending triangle, a bearish continuation pattern characterized by lower highs pressing against level support.

The price hovers around $0.39, just above crucial support levels at $0.38 and $0.36. If these supports fail, the absence of strong technical backing suggests a potential drop to $0.23, nearly a 40% decrease from the current range.
Stellar is under pressure from multiple fronts: declining derivatives activity, bearish crossovers in short- and mid-term charts, and a descending triangle indicating a breakdown risk. Collectively, these factors underscore the potential for a 40% decline unless buyers can regain higher levels quickly.
For buyers, the invalidation level is apparent. A close above $0.43 would breach the triangle upwards, negating the bearish scenario and allowing for recovery potential. Until then, sellers remain dominant.
The post Stellar Price Risks 40% Drop As Three Bearish Setups Align appeared first on BeInCrypto.

