XRP has experienced a decline over the past month due to reduced network activity and weakening investor demand. Will the token face further corrections in the future?
Summary
- XRP price has decreased by 16.8% over the past month.
- Smart money wallets are holding nearly 80% less XRP.
- XRP is trading below key moving averages, indicating a risk of further correction.
Data from crypto.news indicates that XRP (XRP) was trading at $2.93, representing a 19% increase over the last three months and a 63% rise from its year-to-date low. The third-largest cryptocurrency by market capitalization stood at $173.8 billion, with a daily trading volume of $6.4 billion.
These gains were largely driven by investor enthusiasm following Ripple’s significant legal victory against the U.S. Securities and Exchange Commission.
Additionally, the anticipated launch of a spot XRP ETF could potentially create new institutional demand for the token.
Despite XRP’s impressive performance this year, indicators suggest a possible correction. The token has already fallen 16.8% in the last month after reaching its year-to-date high.
Recent data from Nansen reveals that the balance of XRP held by smart money investors has plummeted by 80% in the last 30 days. This trend poses a risk, as such investors often lower their exposure in anticipation of market downturns. Retail investors tend to mimic these actions, which may exacerbate price corrections for the token.

Further data from CoinGlass shows a bearish sentiment among futures traders. Open interest for XRP fell from $10.94 billion in July to $7.56 billion at the time of writing, indicating reduced speculation from investors.
Moreover, the long/short ratio is below 1, suggesting that more traders are betting on a downside.
This trend coincides with subdued activity on the XRP Ledger. Data from Dune indicates that weekly transactions have decreased by 14.8% to 12.4 million, while the number of weekly active addresses fell by 2.1% to 107,340. This slowdown is perceived as a weakening demand for the network, contributing to bearish sentiments surrounding the token.
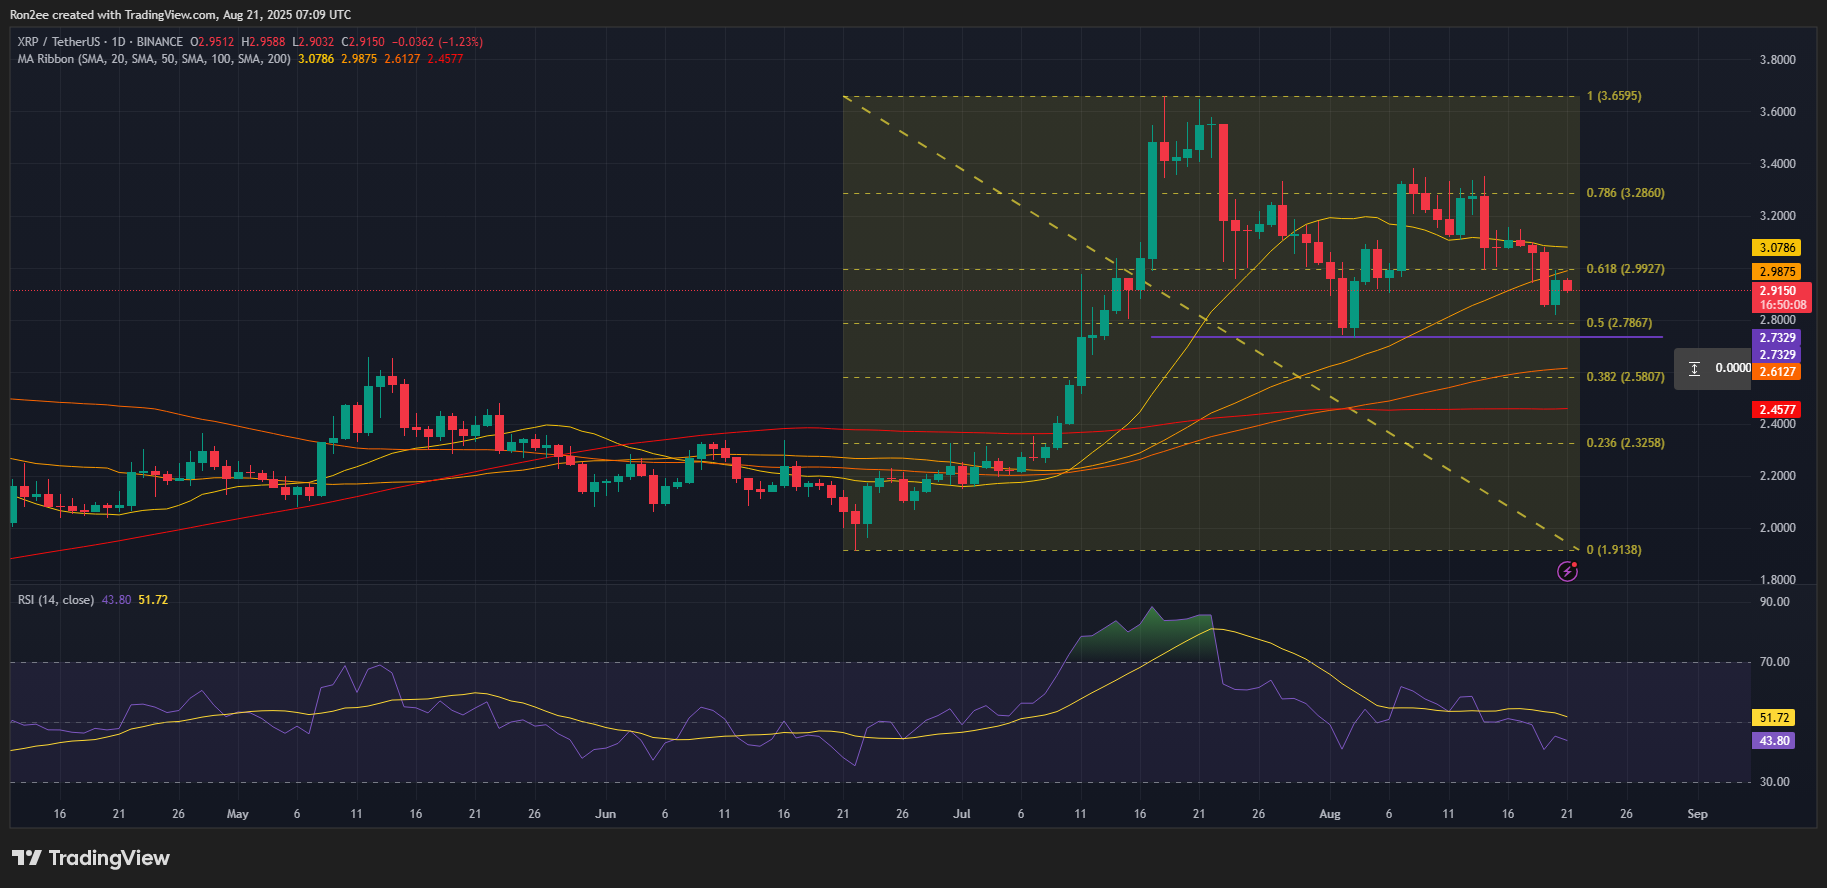
On the daily chart, XRP has dipped below the 20-day and 50-day moving averages, signaling a prevailing bearish momentum.

The Relative Strength Index has also exhibited a bearish divergence in relation to price movements. Such a divergence often signals weakness in the current uptrend, as rising RSI values do not align with increasing price levels. This scenario usually prompts traders to take profits, indicating dwindling investor interest and potential buyer fatigue.
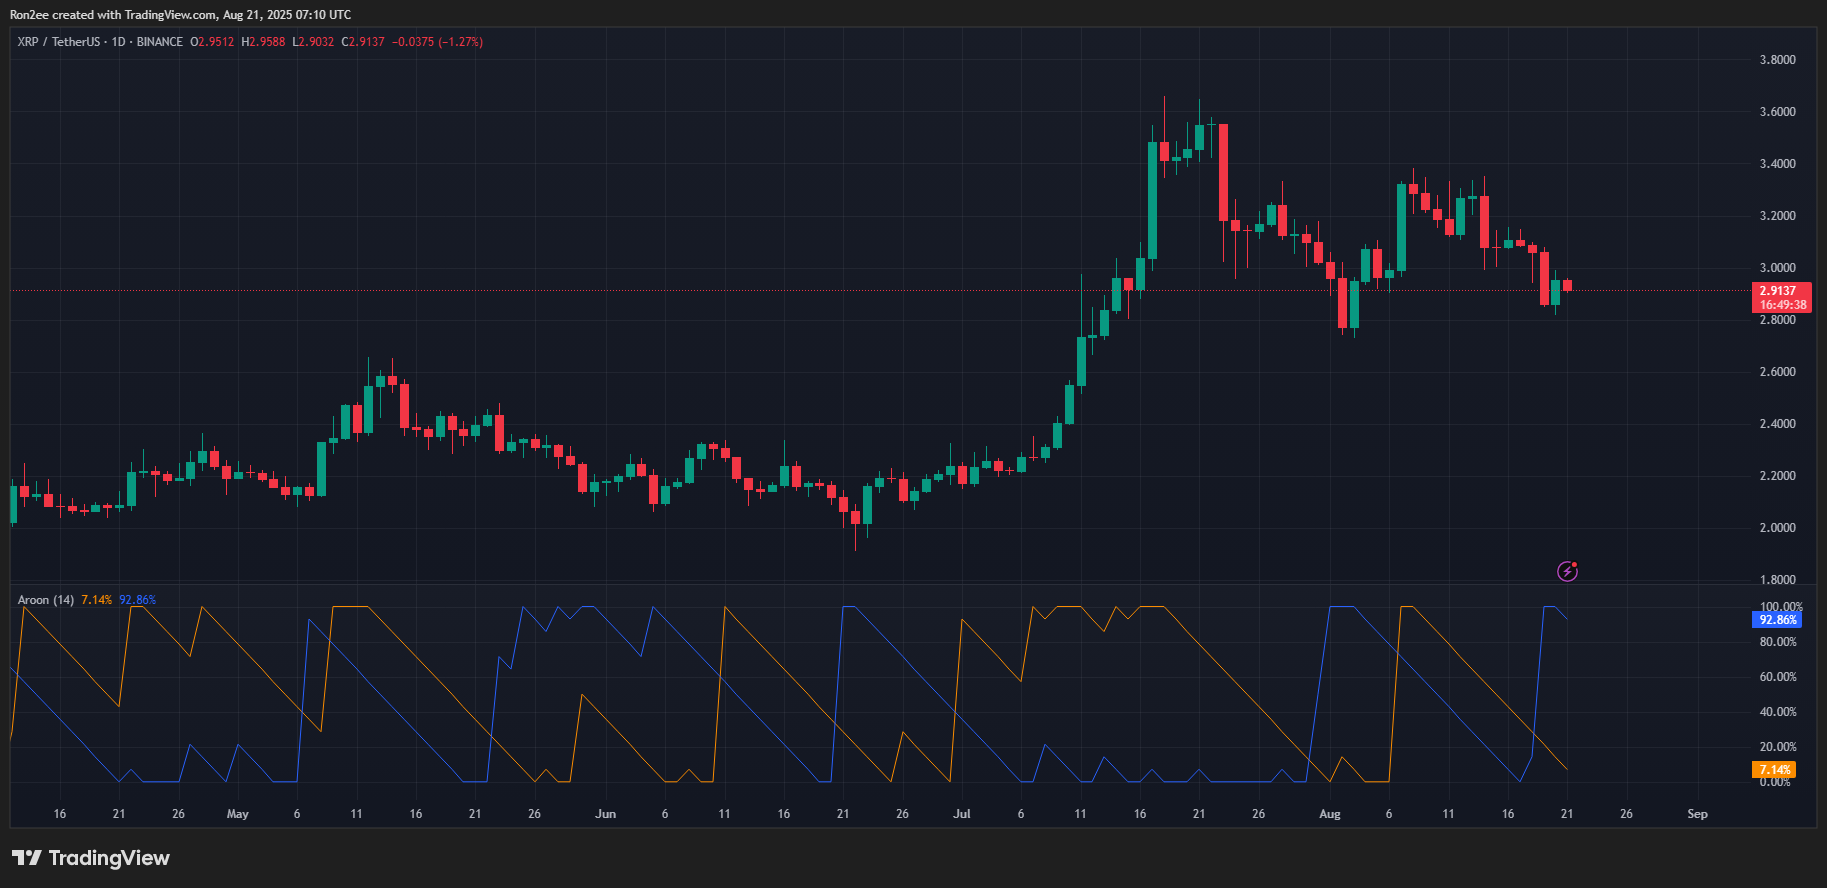
Additionally, the Aroon Down indicator stands at 92.86%, while the Aroon Up remains at 7.14%, reinforcing the strength of the bearish trend.

Given these indicators, XRP may be on track for a correction towards $2.70, a level that previously served as significant support during its decline in August.
A decisive break below this threshold could lead to a further decline toward $2.30, aligning with the 23.6% Fibonacci retracement level.
Disclosure: This article does not constitute investment advice. The content and materials presented on this page are for educational purposes only.

