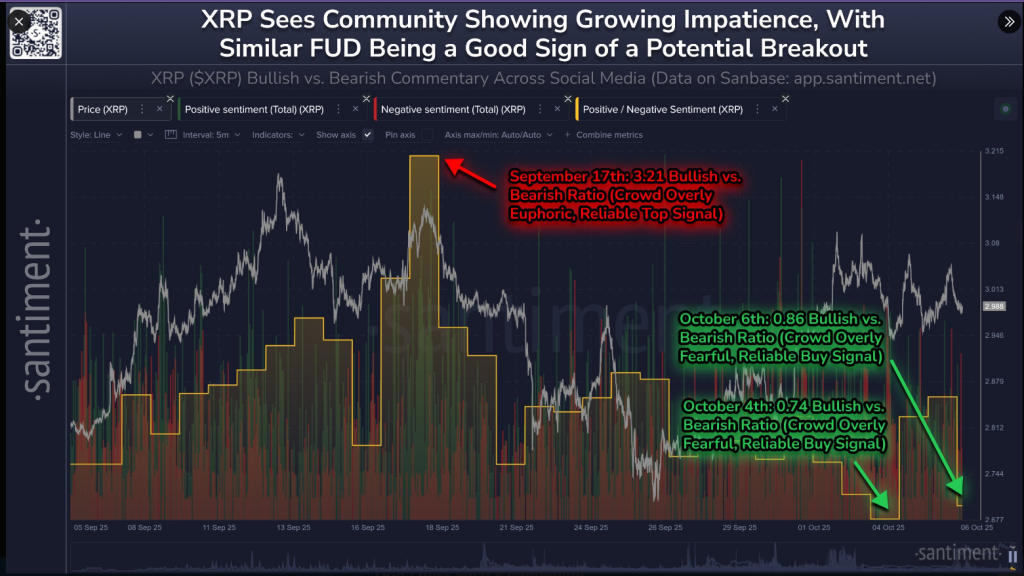
As reported by Santiment, XRP is currently experiencing its highest level of retail fear, uncertainty, and doubt in the past six months. This rise in negativity is being interpreted by some analysts as a contrarian sign — widespread fear might precede a market turnaround.
Related Reading
While traders express their discontent, on-chain data indicates a shift in consumer sentiment towards worry. Santiment highlights that when retail panic escalates, markets often trend in the opposite direction.
Retail Fear Peaks at Six-Month High
Per details from the blockchain analytics provider, the bullish-to-bearish ratio surged to 3.21 on September 17 amid a wave of optimism, only to drop to 0.74 by October 4 as frustration mounted.
The ratio rebounded slightly to 0.86 on October 6. In the last three days observed, bearish sentiment outweighed bullish comments for two days, which Santiment sees as a potential indicator of a market bottom.
Traders should keep in mind that these emotional fluctuations are gauged by public sentiment, and previous spikes in optimism were identified as solid sell signals.
😮 XRP is experiencing its highest level of retail FUD since the announcement of Trump’s tariffs six months ago. There have been more bearish remarks than bullish for two of the last three days, which is typically a positive buy signal. Markets tend to move contrary to small trader expectations. pic.twitter.com/flO7jjlo9m
— Santiment (@santimentfeed) October 7, 2025

Key Technical Levels to Monitor
Recent reports have pinpointed critical price levels that traders are focusing on. XRP is currently priced at $2.85 and has yet to surpass the $3 barrier it briefly reached in recent weeks.
Support is seen around the $2.60–$2.80 range; analyst CryptoInsightUK points out that the $2.72 to $2.75 zone remains a crucial structural level.
Maintaining a position above this range indicates consistent buying interest since the rally from $0.50, the analyst mentioned. Breakthroughs above $3.17 and $3.65 could be interpreted by some as a sign of stronger upward momentum.
Analyst Predictions for a Potential Breakout
According to technical insights from CryptoInsightUK, a movement following the 4.236 Fibonacci extension could aim for $6.90, with a larger wave possibly pushing prices between $8 and $12.
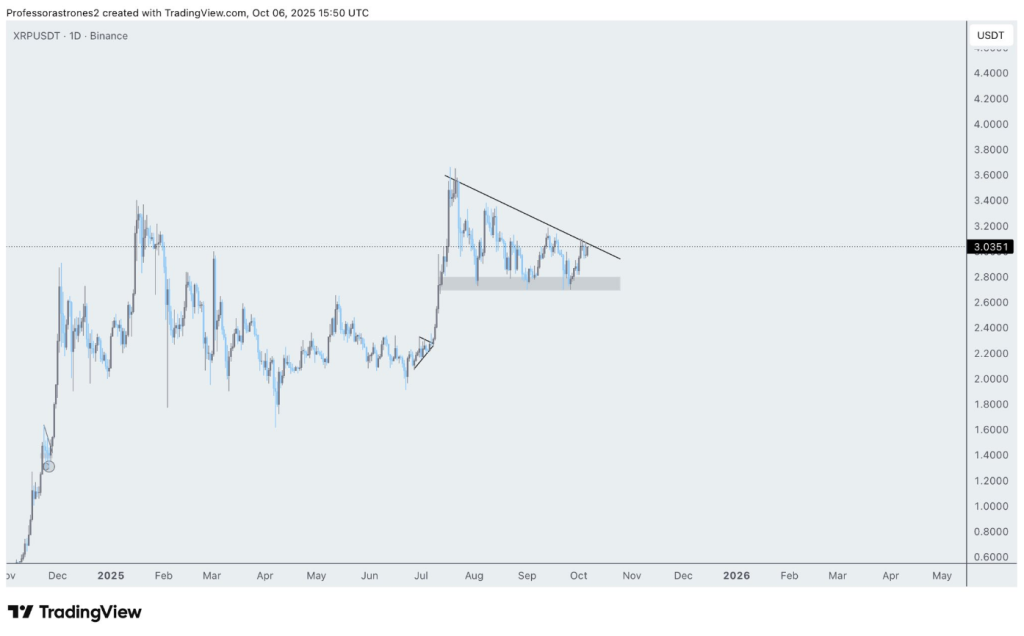
Meanwhile, professor Astrones has identified a bullish pattern on charts, labeling the setup as “pumpy” and hinting at a narrowing range that could break to the upside.
This one is pumpy
First target $5 pic.twitter.com/LzDFTJVHy5
— ProfessorAstrones (@Astrones2) October 6, 2025

Related Reading
Chart patterns like a descending triangle can break either way, prompting traders to look for a definitive close above the specified targets.
In a broader context, Bitcoin has recently surged to a new high above $126,000, and Ethereum is now within 4% of its all-time peak.
However, XRP has faced challenges in surpassing the $3 mark, leading to some investors feeling puzzled. That said, XRP has maintained its position above $2.60 since its breakout to $3.66 in July, suggesting that there is buying interest at current levels.
For now, data and sentiment suggest a potential scenario where fear dissipates before prices increase.
Featured image from Fingerlakes1.com, chart from TradingView

