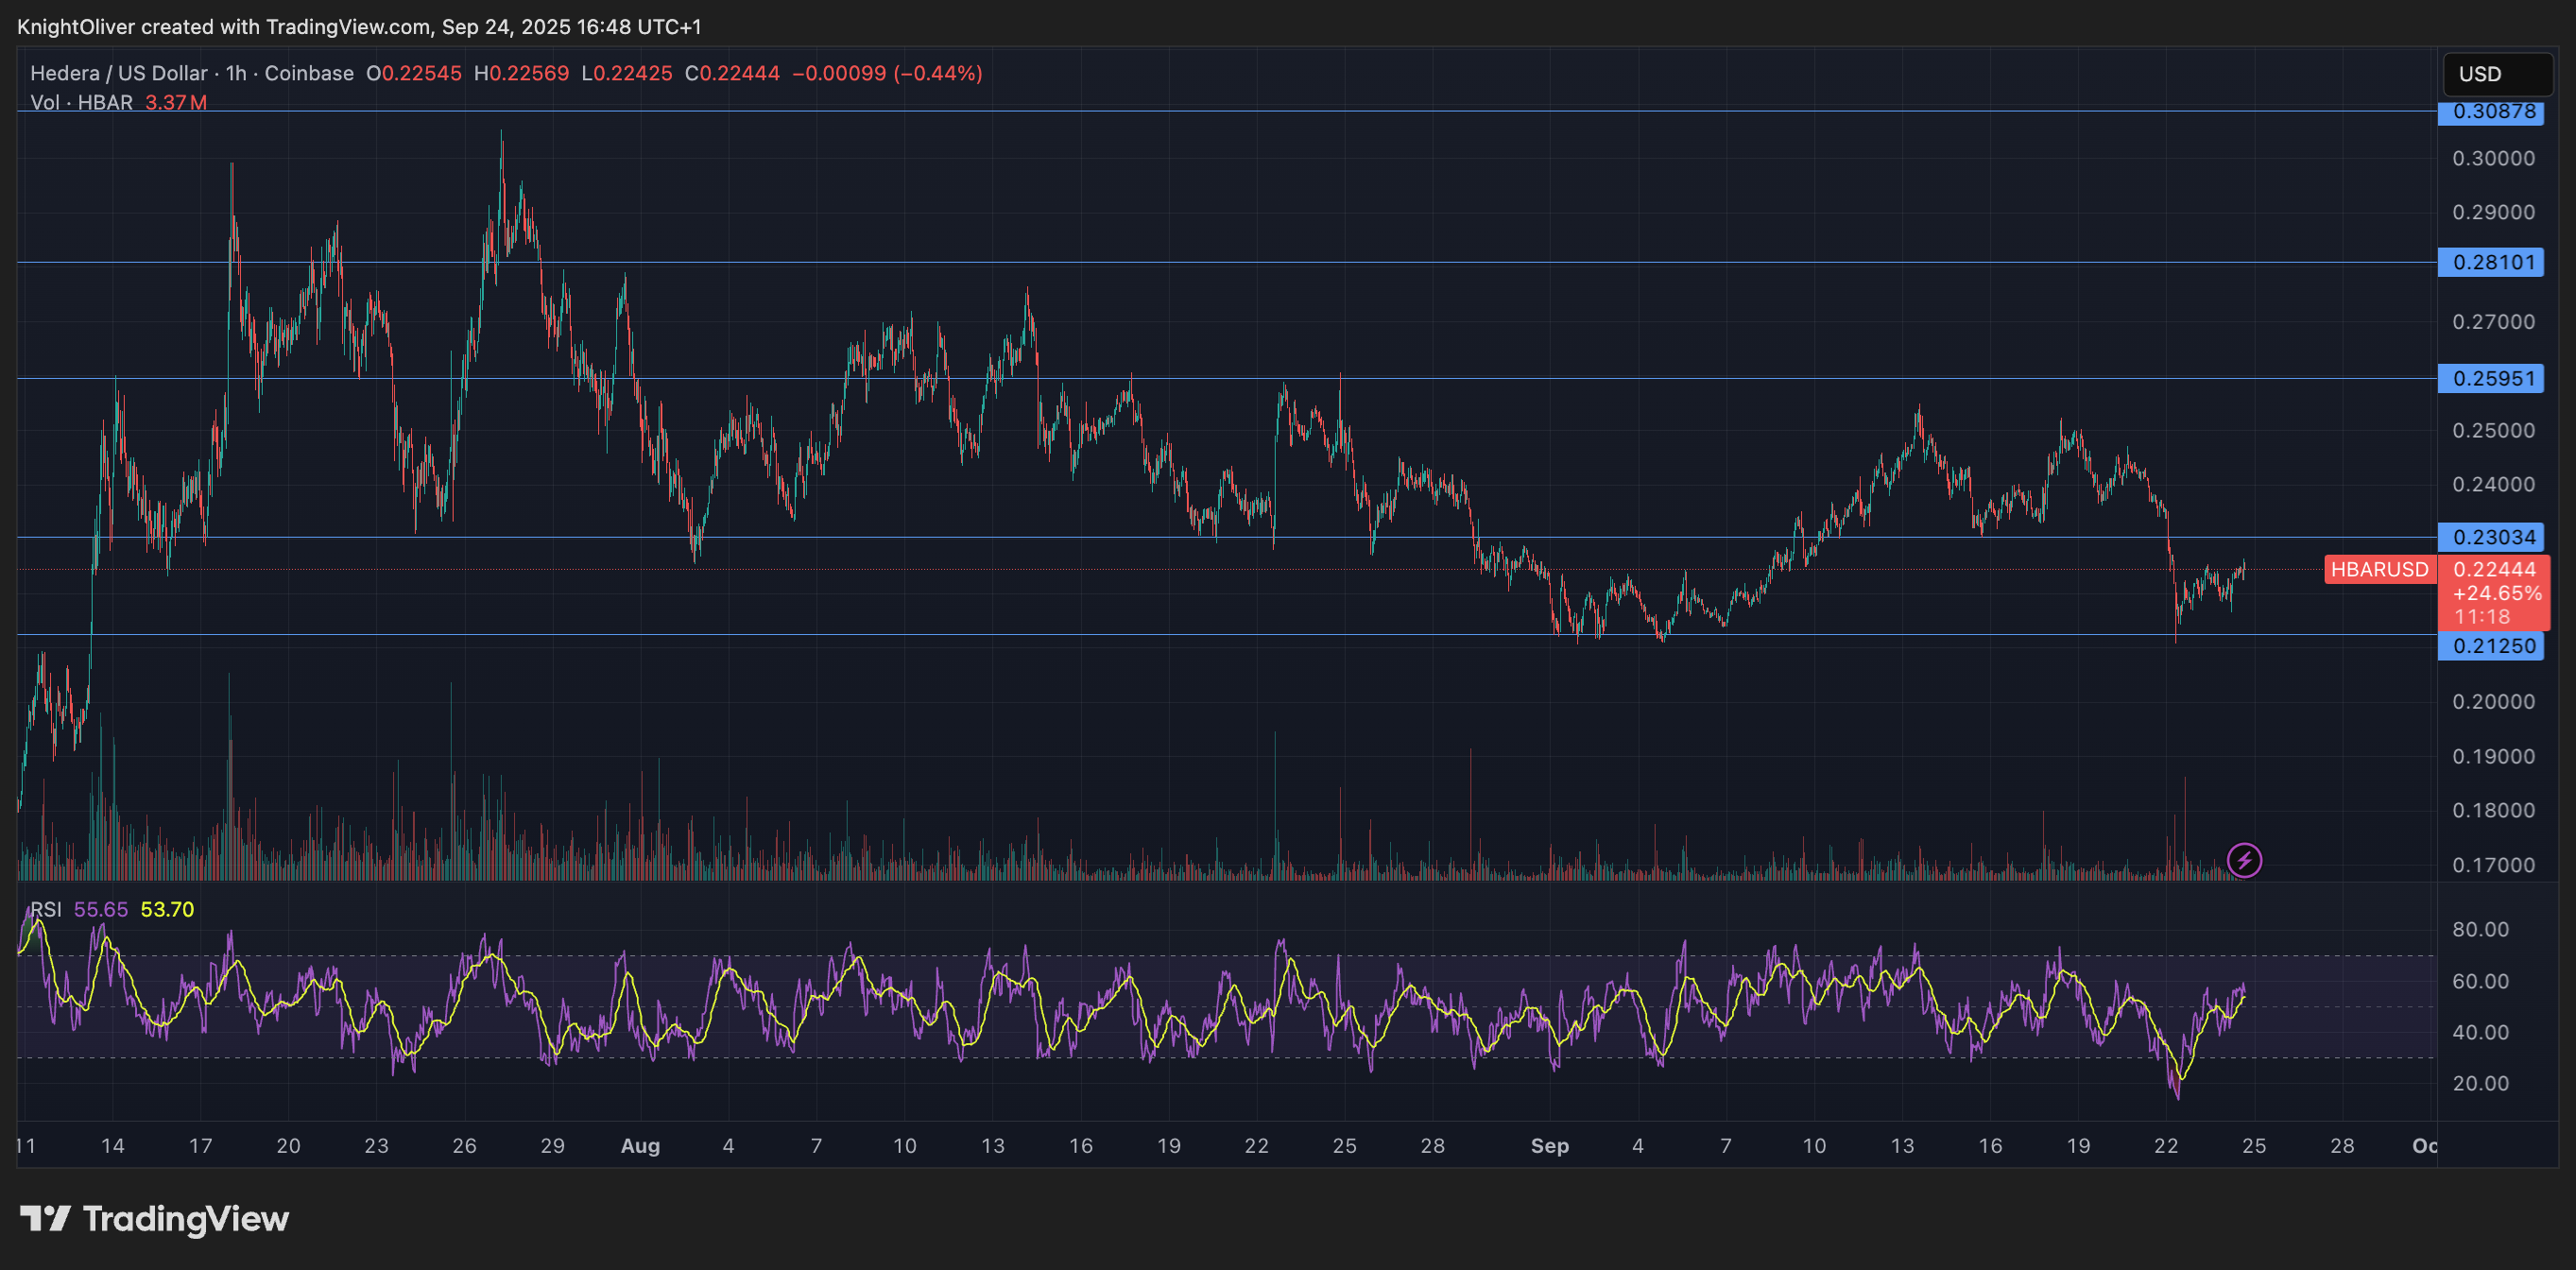
During a 23-hour period from September 23 to 24, HBAR experienced significant volatility, gaining only 0.90% despite large intraday fluctuations. The token traded between $0.217 and $0.225, with a crucial drop to $0.217 at 04:00 on September 24, followed by a robust recovery. This level is now identified as support, whereas $0.225 serves as strong resistance.
Trading volumes indicate that institutional investors entered the market amid the selloff. Turnover reached 97.05 million at 04:00, significantly higher than the average of 37.89 million, indicating accumulation at lower price levels. Subsequently, selling pressure returned, causing HBAR to decline from $0.224 to $0.223 in the last hour of trading, with volume nearly three times the usual amount.
This volatility coincided with a significant announcement: Canary Capital filed for a spot HBAR ETF, featuring a 1.95% expense ratio. Analysts believe this indicates growing institutional acknowledgment of Hedera’s hashgraph technology and could bolster long-term growth prospects, with price forecasts of $0.50 by 2025–2026 and $1.60 or higher by 2030.
In the short term, HBAR’s trajectory depends on whether the support at $0.217–$0.218 holds and if institutional demand continues to counteract selling pressure around the $0.225 mark.

Technical Indicators Highlight Support Levels
- Support zone confirmed at $0.217-$0.218 during session lows
- Resistance ceiling established near $0.225 throughout trading session
- Volume surge to 97.05 million at 04:00 indicates institutional buying interest
- $0.007 trading band represents 3.22% volatility over the 23-hour period
- Last hour’s volume triples to 1.79 million, indicating distribution pressure
Disclaimer: Parts of this article were generated with the assistance from AI tools and reviewed by our editorial team to ensure accuracy and adherence to our standards. For more information, see CoinDesk's full AI Policy.

