Summary
- The prediction for Bitcoin’s price hinges on whether ETF demand exceeds selling pressure.
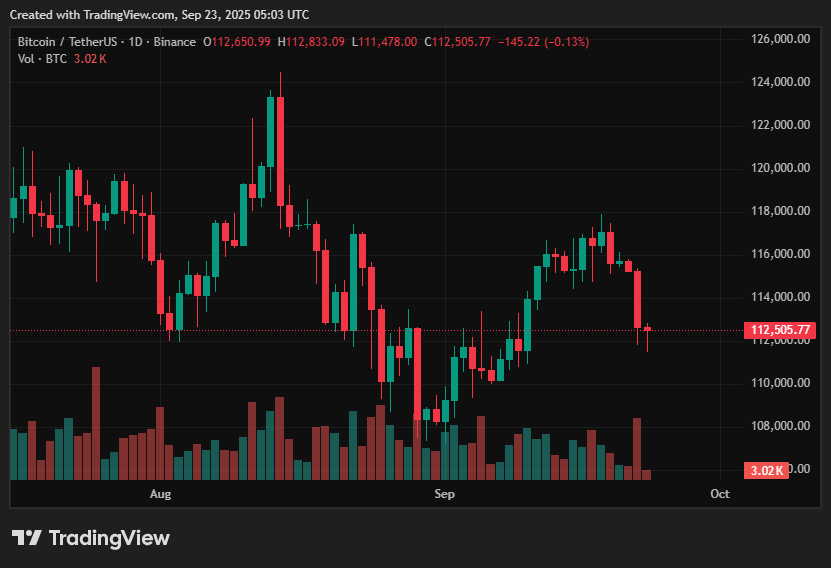
- Bitcoin is trading around $112.7k, within a consolidation range of $112k-$115k.
- ETF inflows are a key driving factor, though recent trends have shown volatility.
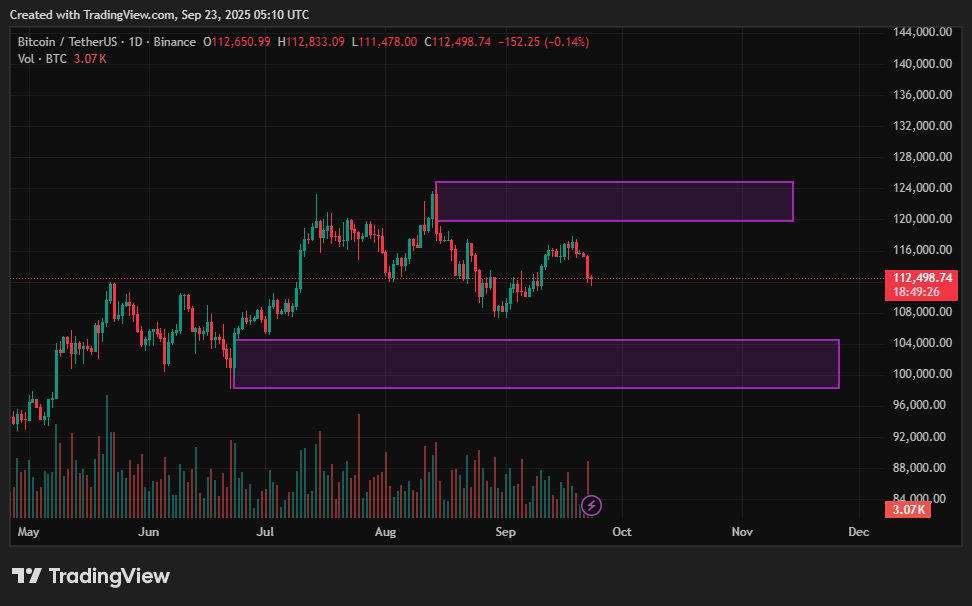
- Upside potential: A breakthrough above $115k could lead to levels between $118k-$122k.
- Downside risks: A fall below $112k may push the price down to $108k, with $105k as a possible extension.
- Profit-taking and the typical September decline heighten bearish risks.
The narrative surrounding Bitcoin price predictions is back in the spotlight as it trades around $112.7k, remaining near critical support levels following significant retracements last week.
Traders are assessing ETF flow dynamics, signals from Fed policy, and overall macro sentiment, while leveraged positions continue to heighten intraday volatility. The large liquidations below $113K serve as a reminder of the rapid momentum shifts that can occur.
Institutional purchases via spot ETFs continue to be the primary structural narrative, but headline flows have lost consistency: weeks with substantial net inflows have been followed by days of minimal outflows as markets react to Fed signals. This tug-of-war between long-term institutional buying and short-term profit-taking is shaping the outlook for Bitcoin, as traders speculate whether BTC can maintain its current levels or dip further.
Current BTC Price Scenario

Bitcoin has remained in a low-to-mid six-figure range, with technical support around $112k and resistance at $115k. Recent volatility saw the price briefly break $113k before returning to approximately $112.7k, indicating that the current consolidation is tenuous. Market participants are closely watching order flow and ETF activity to assess who will absorb selling at these levels.
On-chain and market structure signals present a complex picture: exchange net outflows and previous weeks of ETF accumulation suggest some supply is being withheld, while on-chain indicators show profit-taking and rising altcoin movements during downturns in BTC. These factors combine to create a narrow trading range where momentum indicators can rapidly change.
Upside Outlook
A solid breakout above $115k would likely shift short-term sentiment to bullish, triggering momentum buying towards $118k-$122k, with even higher targets expected if ETF flows pick up. Historically, sustained weekly inflows into ETFs have led Bitcoin to overcome local resistance, as traders and institutions seek to accumulate.
This upward trend would likely require both (a) heightened visible ETF demand and (b) a reduction in liquidation risks across derivatives. Macro factors, such as lower-than-expected inflation or clearer rate-cut signals, could exacerbate the trend by driving risk-on flows to cryptocurrencies. Under these conditions, BTC could maintain higher levels, extending predictions beyond immediate resistance points.
Downside Risks
A failure to hold above $112K would put BTC at risk for a swift retest of $108K, where previous whale accumulation occurred. Should this level falter under strong selling pressure, cascading liquidations might push BTC toward the $105K target, especially if leveraged longs are liquidated en masse. Analysts warn that technical momentum is softening, as depicted by a cooling RSI and normalizing funding rates.
September is also known for seasonal weakness in cryptocurrency markets. This, combined with tendencies for long-term holders to take profits, diminishes bullish expectations and increases the risk of a rapid decline. A more cautious approach is advised until buyers can re-establish dominance through increased ETF inflows and clear spot demand.
BTC Price Prediction Based on Current Levels

The current tactical range to watch is $112k-$115k. If BTC breaks and maintains above $115k on higher volume and renewed ETF activity, the scenario trend towards $118k-$122k becomes increasingly likely in the following weeks, with significant upside risk if institutional buying resurges. This is the optimistic scenario backed by data indicating ongoing inflows and decreasing currency reserves.
Conversely, a decisive drop below $112k would lend credence to the bearish outlook, likely leading to a rapid test of $108k, with $105k as a potential extension target if deleveraging escalates. Traders should keep a close eye on daily ETF flows, open interest in derivatives, and on-chain transfer activity for timely indicators of either breakout or collapse.
Disclosure: This article does not constitute investment advice. The content and materials presented on this page are for educational purposes only.

